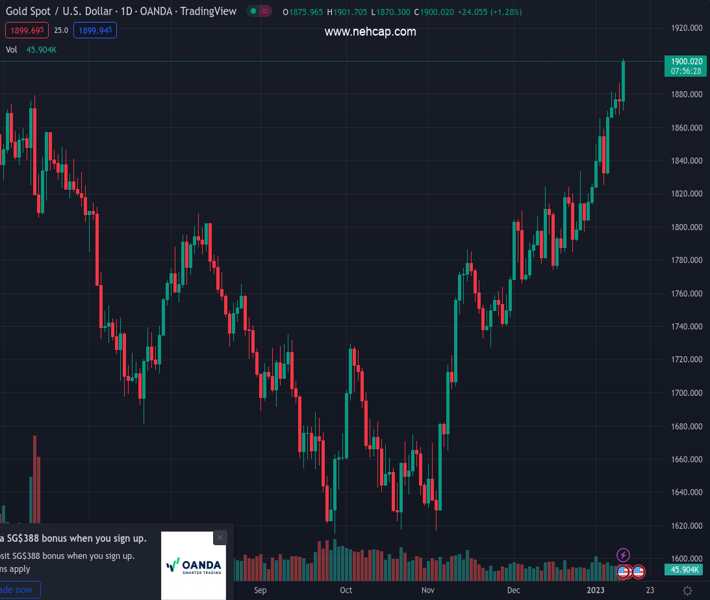
#XAUUSD @ 1,901.02 Gold price touches a fresh multi-month high following the release of the US inflation figures. (Pivot Orderbook analysis)
…
This is a premium post.
[s2If !current_user_can(access_s2member_level4)]Please register for PREMIUM VERSION HERE to read full post below containing analysis. In case of any error or you think you are not able to read the full post below, please email us at support#nehcap.com [lwa][/s2If] [s2If current_user_can(access_s2member_level4)]
- Gold price touches a fresh multi-month high following the release of the US inflation figures.
- The crucial US CPI report cements bets for smaller Fed rate hikes and boosts the XAU/USD.
- The risk-on impulse might hold back bulls from placing fresh bets and cap gains for the metal.
The pair currently trades last at 1901.02.
The previous day high was 1886.67 while the previous day low was 1867.13. The daily 38.2% Fib levels comes at 1874.59, expected to provide support. Similarly, the daily 61.8% fib level is at 1879.21, expected to provide support.
Gold price reverses an early North American session dip to the $1,873 area and jumps to a fresh eight-month high following the release of the US consumer inflation figures. The XAU/USD is currently placed just below the $1,900 mark, up over 1.0% for the day, and seems poised to appreciate further.
The US Dollar bounces off a seven-month low in reaction to mostly in-line US Consumer Price Index (CPI) data, which, in turn, acts as a headwind for the dollar-denominated Gold price. The US Bureau of Labor Statistics reported that the headline US CPI declined 0.1% in December as compared to estimates for a flat reading. The yearly rate, however, matched expectations and decelerated to 6.3% from 7.1% in November. Furthermore, core inflation, which excludes food and energy prices, edge up by 0.3% in December and fell to 5.7% on yearly basis from 6.0% in November.
The mixed data, meanwhile, reaffirms market expectations for a less aggressive policy tightening by the Federal Reserve (Fed) and keeps the US Treasury bond yields depressed. In fact, the yield on the benchmark 10-year US Treasury note languishes near a multi-week low amid rising bets for smaller Fed rate hikes going further. This, in turn, caps the attempted USD recovery and provides a fresh lift to the non-yielding Gold price. That said, a generally positive tone around the equity markets might turn out to be the only factor capping gains for the safe-haven XAU/USD.
Nevertheless, the fundamental backdrop remains tilted firmly in favour of bullish traders. The positive outlook is reinforced by the emergence of some dip-buying in the last hour. This, in turn, supports prospects for a further near-term appreciating move for the Gold price, though it will be prudent to wait for a sustained strength beyond the $1,900 mark before placing fresh bullish bets.
Technical Levels: Supports and Resistances
XAUUSD currently trading at 1887.21 at the time of writing. Pair opened at 1876.52 and is trading with a change of 0.57 % .
| Overview | Overview.1 | |
|---|---|---|
| 0 | Today last price | 1887.21 |
| 1 | Today Daily Change | 10.69 |
| 2 | Today Daily Change % | 0.57 |
| 3 | Today daily open | 1876.52 |
The pair remains strongly bullish on the daily timeframe. It trades above its 20 SMA @ 1823.72, 50 SMA 1782.87, 100 SMA @ 1730.86 and 200 SMA @ 1777.31.
| Trends | Trends.1 | |
|---|---|---|
| 0 | Daily SMA20 | 1823.72 |
| 1 | Daily SMA50 | 1782.87 |
| 2 | Daily SMA100 | 1730.86 |
| 3 | Daily SMA200 | 1777.31 |
The previous day high was 1886.67 while the previous day low was 1867.13. The daily 38.2% Fib levels comes at 1874.59, expected to provide support. Similarly, the daily 61.8% fib level is at 1879.21, expected to provide support.
Note the levels of interest below:
- Pivot support is noted at 1866.88, 1857.23, 1847.34
- Pivot resistance is noted at 1886.42, 1896.31, 1905.96
| Levels | Levels.1 |
|---|---|
| Previous Daily High | 1886.67 |
| Previous Daily Low | 1867.13 |
| Previous Weekly High | 1869.91 |
| Previous Weekly Low | 1823.76 |
| Previous Monthly High | 1833.38 |
| Previous Monthly Low | 1765.89 |
| Daily Fibonacci 38.2% | 1874.59 |
| Daily Fibonacci 61.8% | 1879.21 |
| Daily Pivot Point S1 | 1866.88 |
| Daily Pivot Point S2 | 1857.23 |
| Daily Pivot Point S3 | 1847.34 |
| Daily Pivot Point R1 | 1886.42 |
| Daily Pivot Point R2 | 1896.31 |
| Daily Pivot Point R3 | 1905.96 |
[/s2If]
Join Our Telegram Group
")


