#XAGUSD @ 23.593 Silver attracts fresh buying in the vicinity of support marked by the 200-SMA on the 4-hour chart. (Pivot Orderbook analysis)
…
This is a premium post.
[s2If !current_user_can(access_s2member_level4)]Please register for PREMIUM VERSION HERE to read full post below containing analysis. In case of any error or you think you are not able to read the full post below, please email us at support#nehcap.com [lwa][/s2If] [s2If current_user_can(access_s2member_level4)]
- Silver attracts fresh buying in the vicinity of support marked by the 200-SMA on the 4-hour chart.
- The recent two-way price moves warrant some caution before placing aggressive directional bets.
- Bulls might wait for a sustained move beyond the $24.00 mark before positioning for further gains.
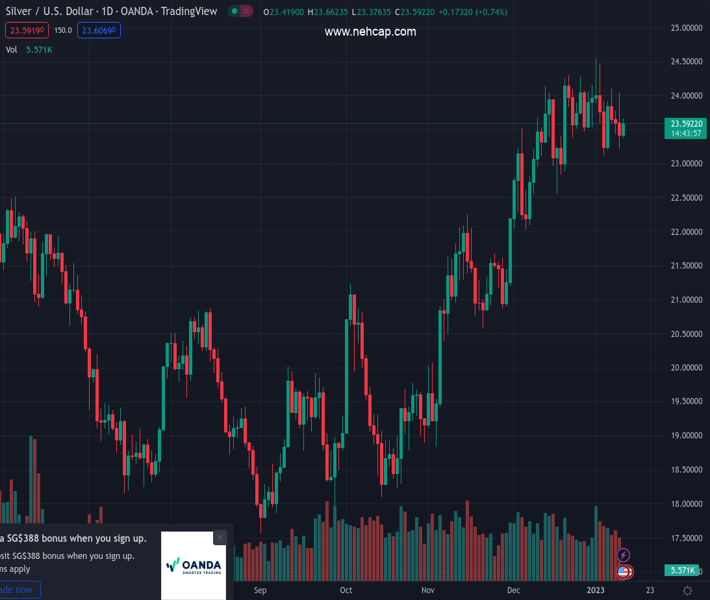
The pair currently trades last at 23.593.
The previous day high was 24.04 while the previous day low was 23.22. The daily 38.2% Fib levels comes at 23.53, expected to provide support. Similarly, the daily 61.8% fib level is at 23.73, expected to provide resistance.
Silver regains some positive traction on Thursday and for now, seems to have snapped a three-day losing streak to the weekly low touched the previous day. The white metal maintains its bid tone through the early European session and is currently placed near the daily high, around the $23.60-$23.65 region.
From a technical perspective, the overnight pullback from the vicinity of the weekly high stalls near the 200-period SMA on the 4-hour chart. The said support, currently around the $23.20 region, should now act as a pivotal point and help determine the next leg of a directional move. Given that the XAG/USD has been struggling to find acceptance above the $24.00 mark, a convincing break below will be seen as a fresh trigger for bearish traders.
That said, oscillators on the daily chart – though have been losing traction – are still holding in the positive territory. This makes it prudent to wait for some follow-through selling below the $23.00 round figure before positioning for a further near-term depreciating move. The XAG/USD might then accelerate the fall towards the $22.60-$22.55 region before eventually dropping to the next relevant support near the $22.10-$22.00 horizontal zone.
On the flip side, any further positive move might confront a stiff hurdle near the weekly top, around the $24.00-$24.10 region. A sustained strength beyond could lift the XAG/USD towards the multi-month high, around the $24.50-$24.55 region touched last week. Some follow-through buying should pave the way for a move towards reclaiming the $25.00 psychological mark.
Technical Levels: Supports and Resistances
XAGUSD currently trading at 23.63 at the time of writing. Pair opened at 23.42 and is trading with a change of 0.9 % .
| Overview | Overview.1 | |
|---|---|---|
| 0 | Today last price | 23.63 |
| 1 | Today Daily Change | 0.21 |
| 2 | Today Daily Change % | 0.90 |
| 3 | Today daily open | 23.42 |
The pair is trading below its 20 Daily moving average @ 23.66, above its 50 Daily moving average @ 22.56 , above its 100 Daily moving average @ 20.85 and above its 200 Daily moving average @ 21.09
| Trends | Trends.1 | |
|---|---|---|
| 0 | Daily SMA20 | 23.66 |
| 1 | Daily SMA50 | 22.56 |
| 2 | Daily SMA100 | 20.85 |
| 3 | Daily SMA200 | 21.09 |
The previous day high was 24.04 while the previous day low was 23.22. The daily 38.2% Fib levels comes at 23.53, expected to provide support. Similarly, the daily 61.8% fib level is at 23.73, expected to provide resistance.
Note the levels of interest below:
- Pivot support is noted at 23.07, 22.73, 22.25
- Pivot resistance is noted at 23.9, 24.38, 24.72
| Levels | Levels.1 |
|---|---|
| Previous Daily High | 24.04 |
| Previous Daily Low | 23.22 |
| Previous Weekly High | 24.55 |
| Previous Weekly Low | 23.12 |
| Previous Monthly High | 24.30 |
| Previous Monthly Low | 22.03 |
| Daily Fibonacci 38.2% | 23.53 |
| Daily Fibonacci 61.8% | 23.73 |
| Daily Pivot Point S1 | 23.07 |
| Daily Pivot Point S2 | 22.73 |
| Daily Pivot Point S3 | 22.25 |
| Daily Pivot Point R1 | 23.90 |
| Daily Pivot Point R2 | 24.38 |
| Daily Pivot Point R3 | 24.72 |
[/s2If]
Join Our Telegram Group
")


