WTI got bolstered by a soft US Dollar, though it struggled to break above solid resistance. (Pivot Orderbook analysis)
…
This is a premium post.
[s2If !current_user_can(access_s2member_level4)]Please register for PREMIUM VERSION HERE to read full post below containing analysis. In case of any error or you think you are not able to read the full post below, please email us at support#nehcap.com [lwa][/s2If] [s2If current_user_can(access_s2member_level4)]
- WTI got bolstered by a soft US Dollar, though it struggled to break above solid resistance.
- The deceleration in US Consumer Price Index (CPI) and expectations for a Fed pivot can underpin WTI prices.
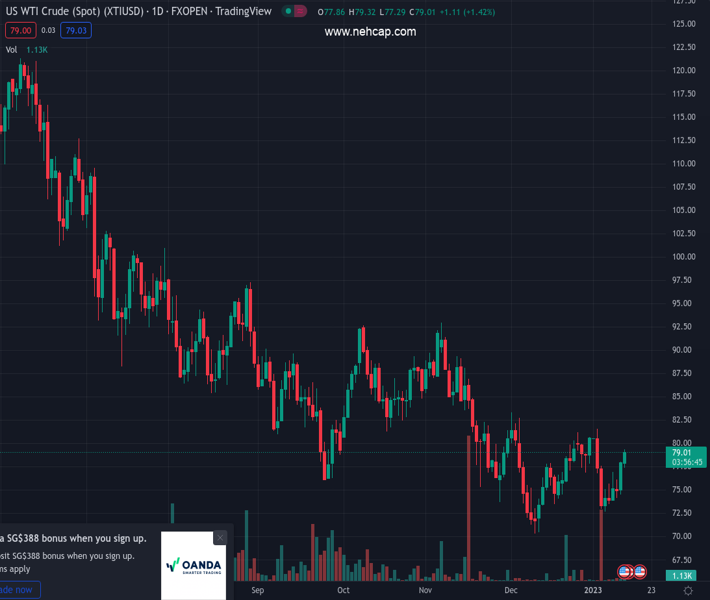
- WTI Price Analysis: Faces a wall of resistance around $79.00.
The pair currently trades last at 79.03.
The previous day high was 78.0 while the previous day low was 74.52. The daily 38.2% Fib levels comes at 76.67, expected to provide support. Similarly, the daily 61.8% fib level is at 75.85, expected to provide support.
Western Texas Intermediate (WTI), the US crude oil benchmark, advanced 0.98% on Thursday and extended its gains to two consecutive days, though it is clashing around technical indicators after releasing crucial US inflation data. At the time of writing, WTI is trading at around $78.40 per barrel.
The US Consumer Price Index (CPI) for December dipped 0.1%, as reported by the Department of Labor (DoL), suggesting that the US Federal Reserve (Fed) could slow down the pace of rate increases, a headwind for the greenback. Therefore, oil prices increased, as a weaker US Dollar would benefit crude buyers.
Another factor that bolstered WTI is China’s reopening after authorities removed Covid-19 zero-tolerance policies.
Sources cited by Reuters commented that a soft landing in the US and maybe worldwide, combined with China’s economic rebound, could make for a much better year than feared by most street analysts. Hence, oil demand could rise, and WTI prices would remain elevated unless the output is increased.
Oil traders are also bracing for an additional curb on Russian oil supply, as sanctions over its invasion of Ukraine are pending to begin. The EU ban on importing petroleum products from Russia will start on February 5, and according to the US EIA office, “it could be more disruptive than the EU ban on importing crude oil from Russia.”
From a daily chart perspective, WTI is neutral to downward biased, albeit extending its gains to almost $4 in the last couple of days. WTI’s inability to crack the confluence of a two-month-old downslope trendline and the 50-day Exponential Moving Average (EMA) around $79.00 could exacerbate a retracement, at least to the 20-day EMA at $76.79. However, if WTI breaks above the former, it can rally toward $80.00. On the flip side, once it clears $78.00, that could pave the way toward the $76.00 figure.
Technical Levels: Supports and Resistances
XTIUSD currently trading at 79.03 at the time of writing. Pair opened at 77.81 and is trading with a change of 1.57 % .
| Overview | Overview.1 | |
|---|---|---|
| 0 | Today last price | 79.03 |
| 1 | Today Daily Change | 1.22 |
| 2 | Today Daily Change % | 1.57 |
| 3 | Today daily open | 77.81 |
The pair is trading above its 20 Daily moving average @ 77.15, below its 50 Daily moving average @ 79.26 , below its 100 Daily moving average @ 82.58 and below its 200 Daily moving average @ 92.64
| Trends | Trends.1 | |
|---|---|---|
| 0 | Daily SMA20 | 77.15 |
| 1 | Daily SMA50 | 79.26 |
| 2 | Daily SMA100 | 82.58 |
| 3 | Daily SMA200 | 92.64 |
The previous day high was 78.0 while the previous day low was 74.52. The daily 38.2% Fib levels comes at 76.67, expected to provide support. Similarly, the daily 61.8% fib level is at 75.85, expected to provide support.
Note the levels of interest below:
- Pivot support is noted at 75.55, 73.29, 72.07
- Pivot resistance is noted at 79.03, 80.26, 82.51
| Levels | Levels.1 |
|---|---|
| Previous Daily High | 78.00 |
| Previous Daily Low | 74.52 |
| Previous Weekly High | 81.56 |
| Previous Weekly Low | 72.64 |
| Previous Monthly High | 83.30 |
| Previous Monthly Low | 70.27 |
| Daily Fibonacci 38.2% | 76.67 |
| Daily Fibonacci 61.8% | 75.85 |
| Daily Pivot Point S1 | 75.55 |
| Daily Pivot Point S2 | 73.29 |
| Daily Pivot Point S3 | 72.07 |
| Daily Pivot Point R1 | 79.03 |
| Daily Pivot Point R2 | 80.26 |
| Daily Pivot Point R3 | 82.51 |
[/s2If]
Join Our Telegram Group
")


