#USDMXN @ 18.8711 US Dollar extends slide versus Emerging Market currencies. (Pivot Orderbook analysis)
…
This is a premium post.
[s2If !current_user_can(access_s2member_level4)]Please register for PREMIUM VERSION HERE to read full post below containing analysis. In case of any error or you think you are not able to read the full post below, please email us at support#nehcap.com [lwa][/s2If] [s2If current_user_can(access_s2member_level4)]
- US Dollar extends slide versus Emerging Market currencies.
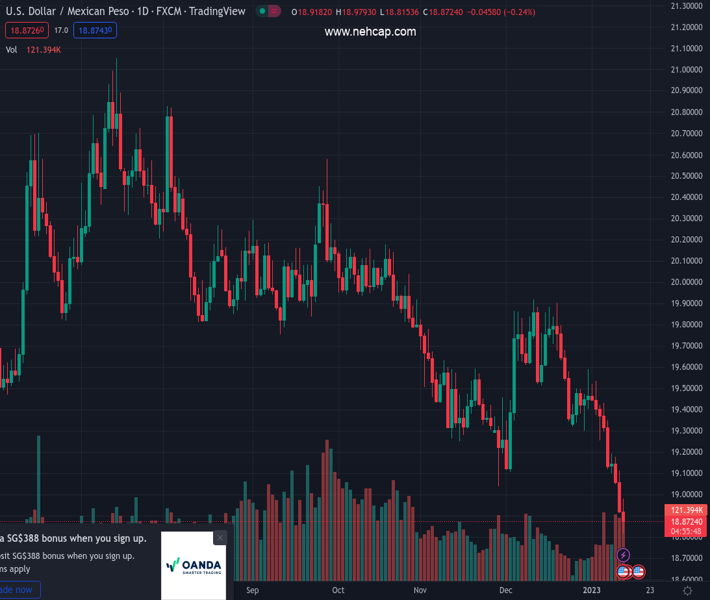
- Mexican Peso is at the highest level since February 2020.
- USD/MXN to remain under pressure below 18.90, despite oversold readings.
The pair currently trades last at 18.8711.
The previous day high was 19.1136 while the previous day low was 18.9154. The daily 38.2% Fib levels comes at 18.9911, expected to provide resistance. Similarly, the daily 61.8% fib level is at 19.0379, expected to provide resistance.
The USD/MXN is falling for the seventh time out of the last eight trading days and trades at the lowest level since February 2020, under 19.00. The pair bottomed at 18.81, before rebounding modestly.
A weaker US Dollar pushed USD/MXN further lower. Technicals also played a role in sending it to the downside. The pair was able to consolidate under the strong support (now resistance) area of 19.00/05.
Technical indicators, like the RSI below 30, are indicating oversold conditions. Despite that, the signs point to further losses. The next support area is seen at 18.75 and then comes the 2020 low near 18.50. A rebound, while contained under 19.15, should not change the current bearish bias for USD/MXN.
Technical Levels: Supports and Resistances
USDMXN currently trading at 18.8714 at the time of writing. Pair opened at 18.9402 and is trading with a change of -0.36 % .
| Overview | Overview.1 | |
|---|---|---|
| 0 | Today last price | 18.8714 |
| 1 | Today Daily Change | -0.0688 |
| 2 | Today Daily Change % | -0.3600 |
| 3 | Today daily open | 18.9402 |
The pair remains strongly bearish on the daily time frame. It trades below the 20 SMA @ 19.4403, 50 SMA 19.4655, 100 SMA @ 19.7392 and 200 SMA @ 19.9496.
| Trends | Trends.1 | |
|---|---|---|
| 0 | Daily SMA20 | 19.4403 |
| 1 | Daily SMA50 | 19.4655 |
| 2 | Daily SMA100 | 19.7392 |
| 3 | Daily SMA200 | 19.9496 |
The previous day high was 19.1136 while the previous day low was 18.9154. The daily 38.2% Fib levels comes at 18.9911, expected to provide resistance. Similarly, the daily 61.8% fib level is at 19.0379, expected to provide resistance.
Note the levels of interest below:
- Pivot support is noted at 18.8658, 18.7915, 18.6677
- Pivot resistance is noted at 19.064, 19.1879, 19.2622
| Levels | Levels.1 |
|---|---|
| Previous Daily High | 19.1136 |
| Previous Daily Low | 18.9154 |
| Previous Weekly High | 19.5361 |
| Previous Weekly Low | 19.1202 |
| Previous Monthly High | 19.9181 |
| Previous Monthly Low | 19.1084 |
| Daily Fibonacci 38.2% | 18.9911 |
| Daily Fibonacci 61.8% | 19.0379 |
| Daily Pivot Point S1 | 18.8658 |
| Daily Pivot Point S2 | 18.7915 |
| Daily Pivot Point S3 | 18.6677 |
| Daily Pivot Point R1 | 19.0640 |
| Daily Pivot Point R2 | 19.1879 |
| Daily Pivot Point R3 | 19.2622 |
[/s2If]
Join Our Telegram Group
")


