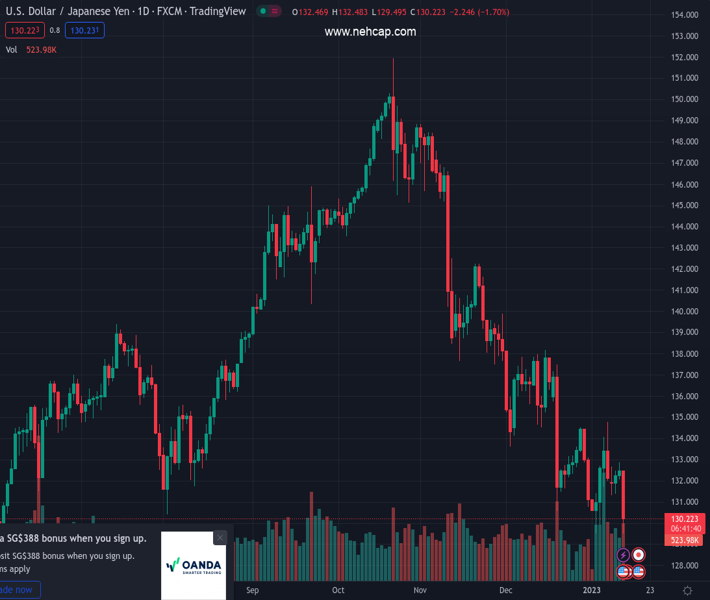
#USDJPY @ 130.143 US inflation cools down, sending the US Dollar tumbling across the board. (Pivot Orderbook analysis)
…
This is a premium post.
[s2If !current_user_can(access_s2member_level4)]Please register for PREMIUM VERSION HERE to read full post below containing analysis. In case of any error or you think you are not able to read the full post below, please email us at support#nehcap.com [lwa][/s2If] [s2If current_user_can(access_s2member_level4)]
- US inflation cools down, sending the US Dollar tumbling across the board.
- Claims for unemployment in the US were less than estimates, portraying a robust labor market.
- Fed’s Harker: Time for the Fed to rate increases at a smaller size.
The pair currently trades last at 130.143.
The previous day high was 132.87 while the previous day low was 132.06. The daily 38.2% Fib levels comes at 132.56, expected to provide resistance. Similarly, the daily 61.8% fib level is at 132.37, expected to provide resistance.
The USD/JPY snaps two days of gains and stumbles more than 200 pips on Thursday, following the release of US inflation data, which cooled down, while claims were lower than estimates. Hence, the USD/JPY is trading at 130.44.
The US Department of Labor revealed that headline inflation, also known as the Consumer Price Index (CPI) for December, decelerated as expected to 6.5% YoY from 7.1% in November. Meanwhile, the month-over-month data showed inflation reading at -0.1%, lower than the 0% estimated. In the meantime, excluding volatile items inflation data, so-called core CPI came at 5.7% YoY, below the 6% foreseen.
Once data was released, the USD/JPY dropped sharply, as data justified US Federal Reserve (Fed) downshift to 25 bps rate hikes as the Fed scrambles to curb high inflation. At the same time, the Bureau of Labor Statistics (BLS) revealed that Initial Jobless Claims for the last week came softer at 205K, less than the 215K petitions expected by analysts, showing the labor market resilience.
Aside from this, Philadelphia’s Fed President Patrick Harker said that 25 bps would be appropriate going forward after the release of the US CPI report. Harker commented that the time for super-size rate hikes has passed and expects a few more rate increases this year.
The USD/JPY 1-hour chart portrays the pair’s reaction to US data. On the release, it tested the YTD low of 129.50, though it resumed to the upside, but readings at the Relative Strength Index (RSI) and the Rate of Change (RoC), confirm that sellers are in charge. Hence, the USD/JPY might resume its downtrend.
The USD/JPY key support levels lie at 130.00, followed by the January 12 low of 129.49. On the flip side, the USD/JPY first resistance level is 131.00, followed by the 20-EMA at 131.26.
Technical Levels: Supports and Resistances
USDJPY currently trading at 130.44 at the time of writing. Pair opened at 132.53 and is trading with a change of -1.46 % .
| Overview | Overview.1 | |
|---|---|---|
| 0 | Today last price | 130.44 |
| 1 | Today Daily Change | -1.93 |
| 2 | Today Daily Change % | -1.46 |
| 3 | Today daily open | 132.53 |
The pair remains strongly bearish on the daily time frame. It trades below the 20 SMA @ 133.12, 50 SMA 137.05, 100 SMA @ 140.8 and 200 SMA @ 136.59.
| Trends | Trends.1 | |
|---|---|---|
| 0 | Daily SMA20 | 133.12 |
| 1 | Daily SMA50 | 137.05 |
| 2 | Daily SMA100 | 140.80 |
| 3 | Daily SMA200 | 136.59 |
The previous day high was 132.87 while the previous day low was 132.06. The daily 38.2% Fib levels comes at 132.56, expected to provide resistance. Similarly, the daily 61.8% fib level is at 132.37, expected to provide resistance.
Note the levels of interest below:
- Pivot support is noted at 132.1, 131.67, 131.29
- Pivot resistance is noted at 132.92, 133.3, 133.73
| Levels | Levels.1 |
|---|---|
| Previous Daily High | 132.87 |
| Previous Daily Low | 132.06 |
| Previous Weekly High | 134.78 |
| Previous Weekly Low | 129.51 |
| Previous Monthly High | 138.18 |
| Previous Monthly Low | 130.57 |
| Daily Fibonacci 38.2% | 132.56 |
| Daily Fibonacci 61.8% | 132.37 |
| Daily Pivot Point S1 | 132.10 |
| Daily Pivot Point S2 | 131.67 |
| Daily Pivot Point S3 | 131.29 |
| Daily Pivot Point R1 | 132.92 |
| Daily Pivot Point R2 | 133.30 |
| Daily Pivot Point R3 | 133.73 |
[/s2If]
Join Our Telegram Group
")


