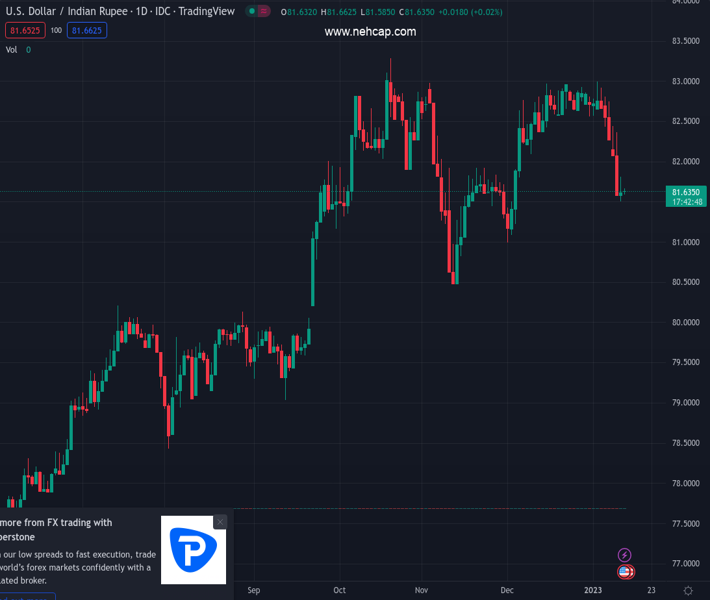
#USDINR @ 81.6500 seesaws near five-week low as bears take a breather after six-day downtrend. (Pivot Orderbook analysis)
…
This is a premium post.
[s2If !current_user_can(access_s2member_level4)]Please register for PREMIUM VERSION HERE to read full post below containing analysis. In case of any error or you think you are not able to read the full post below, please email us at support#nehcap.com [lwa][/s2If] [s2If current_user_can(access_s2member_level4)]
- USD/INR seesaws near five-week low as bears take a breather after six-day downtrend.
- Upbeat Oil prices, unimpressive details from India join mixed China inflation to keep buyers hopeful.
- Markets brace for softer US inflation but a surprise can’t be ruled out.
The pair currently trades last at 81.6500.
The previous day high was 81.8186 while the previous day low was 81.4955. The daily 38.2% Fib levels comes at 81.6189, expected to provide support. Similarly, the daily 61.8% fib level is at 81.6952, expected to provide resistance.
USD/INR treads water around 81.65 as bears run out of steam after six-day dominance. In doing so, the Indian Rupee (INR) pair trades near the lowest level since early December while printing minor gains for the first time in over a week.
The quote’s latest consolidation could be linked to the traders’ anticipation of softer US Consumer Price Index (CPI) data for December, as well as hopes of softer rate hikes and policy pivot in 2023.
The reason could be linked to the recently mixed US data and the downbeat comments from the Federal Reserve (Fed) officials. On Wednesday, Boston Fed President Susan Collins backed the smaller rate increases while stating that she leans at this stage to a 25 bps hike. The policy, however, also mentioned that it is very data-dependent. Earlier in the week, Fed Chair Jerome Powell hesitated in conveying monetary policy outlook and raised hopes of a policy pivot. It’s worth noting that downbeat United States activity numbers and sluggish wage growth join softer prints of the NFIB Business Optimism Index for December and mixed Wholesale Inventories for November of late.
On the other hand, the WTI crude oil jumped the most in two months the previous day amid hopes of more energy demand from China, mildly offered near $77.80 by the press time. That said, the black gold’s latest pullback could also be linked to the high inventory build as Reuters quotes the US Energy Information Administration (EIA) saying that crude inventories jumped by 19.0 million barrels last week, the third biggest weekly gain ever and the most since stocks rose by a record 21.6 million barrels in Feb 2021.
Elsewhere, China’s headline CPI YoY grew 1.8% YoY versus 1.8% expected and 1.6% prior whereas the Producer Price Index (PPI) marked -0.7% figures compared to -1.3% previous readings and -0.1% market forecasts. It should be noted that China’s total reopening and early signals of heavy holiday shopping join the chatters that the People’s Bank of China (PBOC) will adhere to rate cuts in 2023 to spread the Beijing-inspired optimism and put a floor under USD/INR prices.
Moving ahead, USD/INR traders should pay attention to US CPI details, more importantly to the US CPI ex Food & Energy, amid downbeat expectations and the Fed policymakers’ hesitance in being hawkish. Should the actual outcome arrive as weak, the USD/INR pair may drop further toward 81.00.
A daily closing below five-month-old ascending support line, now resistance around 81.75, keeps USD/INR buyers hopeful of witnessing further declines.
Technical Levels: Supports and Resistances
USDINR currently trading at 81.6395 at the time of writing. Pair opened at 81.5947 and is trading with a change of 0.05% % .
| Overview | Overview.1 | |
|---|---|---|
| 0 | Today last price | 81.6395 |
| 1 | Today Daily Change | 0.0448 |
| 2 | Today Daily Change % | 0.05% |
| 3 | Today daily open | 81.5947 |
The pair is trading below its 20 Daily moving average @ 82.5858, below its 50 Daily moving average @ 82.0628 , above its 100 Daily moving average @ 81.6255 and above its 200 Daily moving average @ 79.8955
| Trends | Trends.1 | |
|---|---|---|
| 0 | Daily SMA20 | 82.5858 |
| 1 | Daily SMA50 | 82.0628 |
| 2 | Daily SMA100 | 81.6255 |
| 3 | Daily SMA200 | 79.8955 |
The previous day high was 81.8186 while the previous day low was 81.4955. The daily 38.2% Fib levels comes at 81.6189, expected to provide support. Similarly, the daily 61.8% fib level is at 81.6952, expected to provide resistance.
Note the levels of interest below:
- Pivot support is noted at 81.4539, 81.3131, 81.1308
- Pivot resistance is noted at 81.7771, 81.9594, 82.1002
| Levels | Levels.1 |
|---|---|
| Previous Daily High | 81.8186 |
| Previous Daily Low | 81.4955 |
| Previous Weekly High | 83.0720 |
| Previous Weekly Low | 82.1896 |
| Previous Monthly High | 84.2500 |
| Previous Monthly Low | 80.9855 |
| Daily Fibonacci 38.2% | 81.6189 |
| Daily Fibonacci 61.8% | 81.6952 |
| Daily Pivot Point S1 | 81.4539 |
| Daily Pivot Point S2 | 81.3131 |
| Daily Pivot Point S3 | 81.1308 |
| Daily Pivot Point R1 | 81.7771 |
| Daily Pivot Point R2 | 81.9594 |
| Daily Pivot Point R3 | 82.1002 |
[/s2If]
Join Our Telegram Group
")


