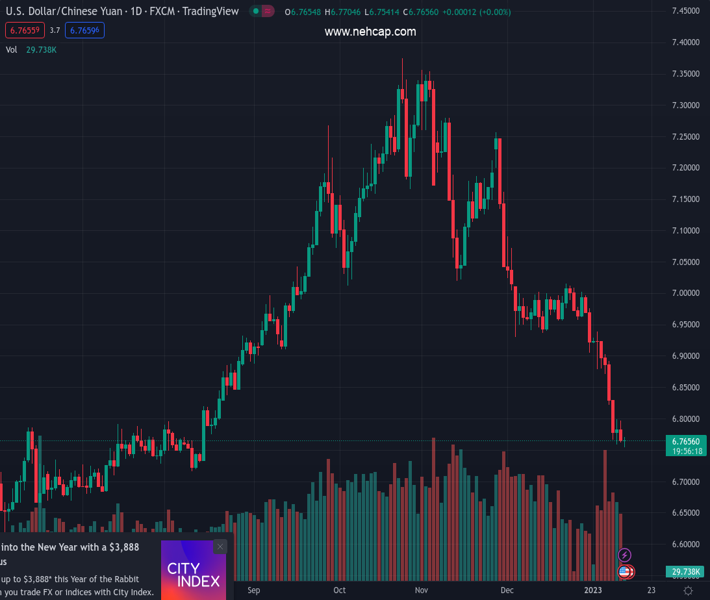
#USDCNH @ 6.76490 has picked strength amid a sheer contraction in China’s factory gate price index by 0.7%. (Pivot Orderbook analysis)
…
This is a premium post.
[s2If !current_user_can(access_s2member_level4)]Please register for PREMIUM VERSION HERE to read full post below containing analysis. In case of any error or you think you are not able to read the full post below, please email us at support#nehcap.com [lwa][/s2If] [s2If current_user_can(access_s2member_level4)]
- USD/CNH has picked strength amid a sheer contraction in China’s factory gate price index by 0.7%.
- The upbeat market mood is weighing on the US Treasury yields.
- A decline in energy prices may result in further softening in the US inflation.
The pair currently trades last at 6.76490.
The previous day high was 6.7974 while the previous day low was 6.7624. The daily 38.2% Fib levels comes at 6.7758, expected to provide resistance. Similarly, the daily 61.8% fib level is at 6.7841, expected to provide resistance.
The USD/CNH pair has recovered after dropping to near 6.7550 in the Asian session. The asset has sensed demand and has extended recovery to near 6.7700 despite China’s National Bureau of Statistics (NBS) having reported mixed Consumer Price Index (CPI) data for December.
The annual CPI figure has remained in line with the expectations at 1.8% and higher than the former release of 1.6%. While, the price index at the factory gate has dropped sharply, signaling less bargaining power from producers. The Producer Price Index (PPI) has shrunk by 0.7% vs. the expectation of 0.1% contraction.
The sheer pace adopted by the Chinese administration in reopening the economy after a stretched lockdown period to combat the Covid-19 pandemic has brought a sense of optimism among market participants. The street is expected a vertical recovery in economic prospects and international trade.
Analysts at Morgan Stanley raised their forecast for China’s Gross Domestic Product (GDP) this year to above 5.0%. They further added that “If policy can remove barriers to the housing/property sectors and recovery from COVID zero then China’s economic recovery should solidify starting in Q2 of this year.”
Meanwhile, higher investors’ risk appetite led by string recovery in S&P500 futures this week is showing strength in risk-sensitive assets. The 10-year US Treasury yields have been weighed down by the upbeat market mood to 3.55%. The US Dollar Index (DXY) has faced barricades around 102.80 and has tilted towards the south ahead of United States inflation data.
Analysts at Wells Fargo expect another sizable decline in energy prices to weigh on the headline and offset further gains in food and core services prices. But the drop in prices should also be helped along by another decline in core goods, led once again by used autos.
Technical Levels: Supports and Resistances
USDCNH currently trading at 6.7636 at the time of writing. Pair opened at 6.766 and is trading with a change of -0.04 % .
| Overview | Overview.1 | |
|---|---|---|
| 0 | Today last price | 6.7636 |
| 1 | Today Daily Change | -0.0024 |
| 2 | Today Daily Change % | -0.0400 |
| 3 | Today daily open | 6.7660 |
The pair remains strongly bearish on the daily time frame. It trades below the 20 SMA @ 6.93, 50 SMA 7.0331, 100 SMA @ 7.0657 and 200 SMA @ 6.877.
| Trends | Trends.1 | |
|---|---|---|
| 0 | Daily SMA20 | 6.9300 |
| 1 | Daily SMA50 | 7.0331 |
| 2 | Daily SMA100 | 7.0657 |
| 3 | Daily SMA200 | 6.8770 |
The previous day high was 6.7974 while the previous day low was 6.7624. The daily 38.2% Fib levels comes at 6.7758, expected to provide resistance. Similarly, the daily 61.8% fib level is at 6.7841, expected to provide resistance.
Note the levels of interest below:
- Pivot support is noted at 6.7532, 6.7403, 6.7182
- Pivot resistance is noted at 6.7882, 6.8103, 6.8232
| Levels | Levels.1 |
|---|---|
| Previous Daily High | 6.7974 |
| Previous Daily Low | 6.7624 |
| Previous Weekly High | 6.9396 |
| Previous Weekly Low | 6.8236 |
| Previous Monthly High | 7.0914 |
| Previous Monthly Low | 6.9050 |
| Daily Fibonacci 38.2% | 6.7758 |
| Daily Fibonacci 61.8% | 6.7841 |
| Daily Pivot Point S1 | 6.7532 |
| Daily Pivot Point S2 | 6.7403 |
| Daily Pivot Point S3 | 6.7182 |
| Daily Pivot Point R1 | 6.7882 |
| Daily Pivot Point R2 | 6.8103 |
| Daily Pivot Point R3 | 6.8232 |
[/s2If]
Join Our Telegram Group
")


