#USDCHF @ 0.92750 seesawed in a 100-pip range but finished Thursday’s session with losses of 0.44%. (Pivot Orderbook analysis)
…
This is a premium post.
[s2If !current_user_can(access_s2member_level4)]Please register for PREMIUM VERSION HERE to read full post below containing analysis. In case of any error or you think you are not able to read the full post below, please email us at support#nehcap.com [lwa][/s2If] [s2If current_user_can(access_s2member_level4)]
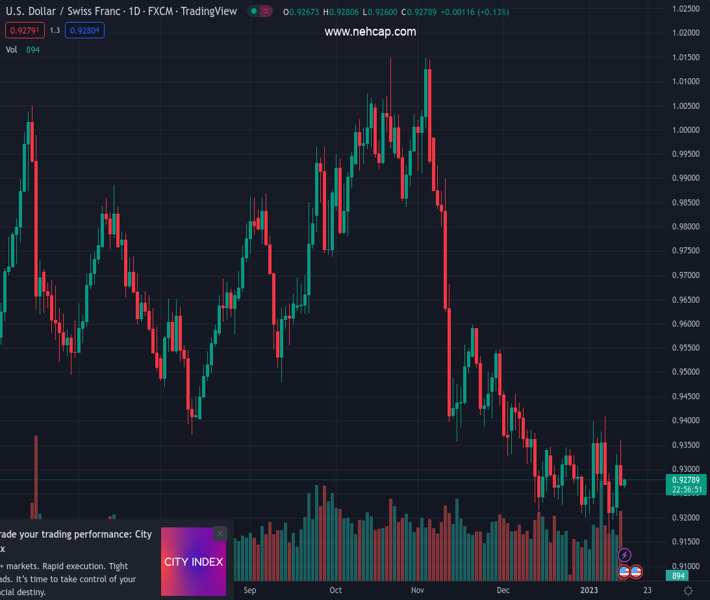
- USD/CHF seesawed in a 100-pip range but finished Thursday’s session with losses of 0.44%.
- The USD/CHF remains downward biased, but it needs to drop below 0.9200 to challenge the 0.9167 YTD low.
- It would turn bullish above the 20-day EMA nearby 0.9300.
The pair currently trades last at 0.92750.
The previous day high was 0.9332 while the previous day low was 0.9205. The daily 38.2% Fib levels comes at 0.9283, expected to provide resistance. Similarly, the daily 61.8% fib level is at 0.9253, expected to provide support.
After attempting to clear 0.9300, the USD/CHF resumed its downtrend due to the release of a softer inflation report in the United States (US), which spurred a repricing for a less aggressive Federal Reserve (Fed); consequently, the US Dollar weakened. Therefore, the USD/CHF erased its earlier gains and dived beneath 0.9280 as the Asian session began. At the time of writing, the USD/CHF is almost unchanged, around 0.9270.
Following the release of the US CPI, the USD/CHF seesawed in the 0.9265/0.9360 range before stabilizing around 0.9270, 30 pips below the 20-day Exponential Moving Average (EMA) at 0.9294. Oscillators like the Relative Strength Index (RSI) pointing downwards and the Rate of Change (RoC) almost flat suggests sellers are gathering momentum. However, to further extend its downtrend, USD/CHF bears need to decisively break below 0.9265 to aim towards the 0.9200 mark and wall of support.
On the other hand, if USD/CHF buyers reclaim the 20-day EMA, that will immediately expose 0.9300, followed by the current week’s high of 0.9360, on its way north to 0.9400.
Technical Levels: Supports and Resistances
USDCHF currently trading at 0.9271 at the time of writing. Pair opened at 0.9312 and is trading with a change of -0.44 % .
| Overview | Overview.1 | |
|---|---|---|
| 0 | Today last price | 0.9271 |
| 1 | Today Daily Change | -0.0041 |
| 2 | Today Daily Change % | -0.4400 |
| 3 | Today daily open | 0.9312 |
The pair remains strongly bearish on the daily time frame. It trades below the 20 SMA @ 0.929, 50 SMA 0.9428, 100 SMA @ 0.9632 and 200 SMA @ 0.9644.
| Trends | Trends.1 | |
|---|---|---|
| 0 | Daily SMA20 | 0.9290 |
| 1 | Daily SMA50 | 0.9428 |
| 2 | Daily SMA100 | 0.9632 |
| 3 | Daily SMA200 | 0.9644 |
The previous day high was 0.9332 while the previous day low was 0.9205. The daily 38.2% Fib levels comes at 0.9283, expected to provide resistance. Similarly, the daily 61.8% fib level is at 0.9253, expected to provide support.
Note the levels of interest below:
- Pivot support is noted at 0.9234, 0.9156, 0.9107
- Pivot resistance is noted at 0.9361, 0.941, 0.9488
| Levels | Levels.1 |
|---|---|
| Previous Daily High | 0.9332 |
| Previous Daily Low | 0.9205 |
| Previous Weekly High | 0.9410 |
| Previous Weekly Low | 0.9223 |
| Previous Monthly High | 0.9471 |
| Previous Monthly Low | 0.9201 |
| Daily Fibonacci 38.2% | 0.9283 |
| Daily Fibonacci 61.8% | 0.9253 |
| Daily Pivot Point S1 | 0.9234 |
| Daily Pivot Point S2 | 0.9156 |
| Daily Pivot Point S3 | 0.9107 |
| Daily Pivot Point R1 | 0.9361 |
| Daily Pivot Point R2 | 0.9410 |
| Daily Pivot Point R3 | 0.9488 |
[/s2If]
Join Our Telegram Group
")


