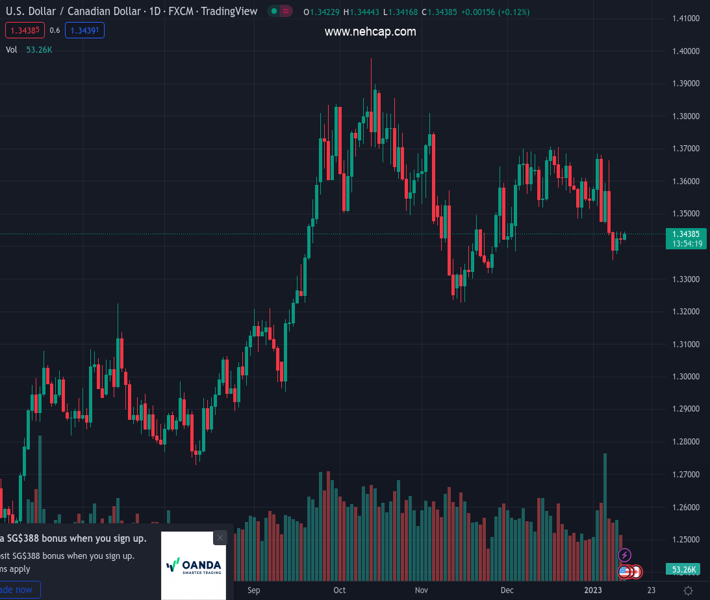
#USDCAD @ 1.34361 attracts fresh buying on Thursday, though the upside potential seems limited. (Pivot Orderbook analysis)
…
This is a premium post.
[s2If !current_user_can(access_s2member_level4)]Please register for PREMIUM VERSION HERE to read full post below containing analysis. In case of any error or you think you are not able to read the full post below, please email us at support#nehcap.com [lwa][/s2If] [s2If current_user_can(access_s2member_level4)]
- USD/CAD attracts fresh buying on Thursday, though the upside potential seems limited.
- A modest downtick in oil prices undermines the Loonie and lends support to the major.
- Smaller Fed rate hike bets weigh on the USD and could cap gains ahead of the US CPI.
The pair currently trades last at 1.34361.
The previous day high was 1.3445 while the previous day low was 1.3404. The daily 38.2% Fib levels comes at 1.343, expected to provide support. Similarly, the daily 61.8% fib level is at 1.342, expected to provide support.
The USD/CAD pair regains positive traction on Thursday and steadily climbs to the top end of its weekly range, closer to mid-1.3400s during the early European session. The intraday move up, however, lacks bullish conviction and is more likely to remain capped ahead of the release of the latest US consumer inflation figures.
In the meantime, a modest pullback in crude oil prices from over a one-week high touched on Wednesday undermines the commodity-linked Loonie and lends some support to the USD/CAD pair. Despite the recent optimism led by China’s pivot away from its zero-COVID policy, worries that a deeper global economic downturn will hurt demand act as a headwind for the black liquid. That said, subdued US Dollar price action might hold back traders from placing aggressive bullish bets around the major and keep a lid on any further gains.
In fact, the USD Index, which measures the greenback’s performance against a basket of currencies, languishes near a seven-month low amid the prospects for smaller rate hikes by the Fed. Investors now seem convinced that the US central bank will soften its hawkish stance amid signs of easing inflation. This is evident from a further decline in the US Treasury bond yields and continues to weigh on the greenback. Traders, however, might prefer to wait for the crucial US CPI report before determining the near-term trajectory.
The Fed policymakers have indicated that they remain committed to combat high inflation and that rates could remain elevated for longer, or until there is clear evidence that consumer prices are falling. Hence, a stronger US CPI print will lift bets for a more hawkish Fed and push the USD higher, allowing the USD/CAD pair to build on this week’s recovery from its lowest level since November 25. Conversely, a softer reading will set the stage for an extension of the recent rejection slide from the 1.3700 round-figure mark.
Technical Levels: Supports and Resistances
USDCAD currently trading at 1.3444 at the time of writing. Pair opened at 1.3427 and is trading with a change of 0.13 % .
| Overview | Overview.1 | |
|---|---|---|
| 0 | Today last price | 1.3444 |
| 1 | Today Daily Change | 0.0017 |
| 2 | Today Daily Change % | 0.1300 |
| 3 | Today daily open | 1.3427 |
The pair is trading below its 20 Daily moving average @ 1.3563, below its 50 Daily moving average @ 1.3507 , below its 100 Daily moving average @ 1.3488 and above its 200 Daily moving average @ 1.3161
| Trends | Trends.1 | |
|---|---|---|
| 0 | Daily SMA20 | 1.3563 |
| 1 | Daily SMA50 | 1.3507 |
| 2 | Daily SMA100 | 1.3488 |
| 3 | Daily SMA200 | 1.3161 |
The previous day high was 1.3445 while the previous day low was 1.3404. The daily 38.2% Fib levels comes at 1.343, expected to provide support. Similarly, the daily 61.8% fib level is at 1.342, expected to provide support.
Note the levels of interest below:
- Pivot support is noted at 1.3406, 1.3385, 1.3366
- Pivot resistance is noted at 1.3447, 1.3466, 1.3487
| Levels | Levels.1 |
|---|---|
| Previous Daily High | 1.3445 |
| Previous Daily Low | 1.3404 |
| Previous Weekly High | 1.3685 |
| Previous Weekly Low | 1.3433 |
| Previous Monthly High | 1.3705 |
| Previous Monthly Low | 1.3385 |
| Daily Fibonacci 38.2% | 1.3430 |
| Daily Fibonacci 61.8% | 1.3420 |
| Daily Pivot Point S1 | 1.3406 |
| Daily Pivot Point S2 | 1.3385 |
| Daily Pivot Point S3 | 1.3366 |
| Daily Pivot Point R1 | 1.3447 |
| Daily Pivot Point R2 | 1.3466 |
| Daily Pivot Point R3 | 1.3487 |
[/s2If]
Join Our Telegram Group
")


