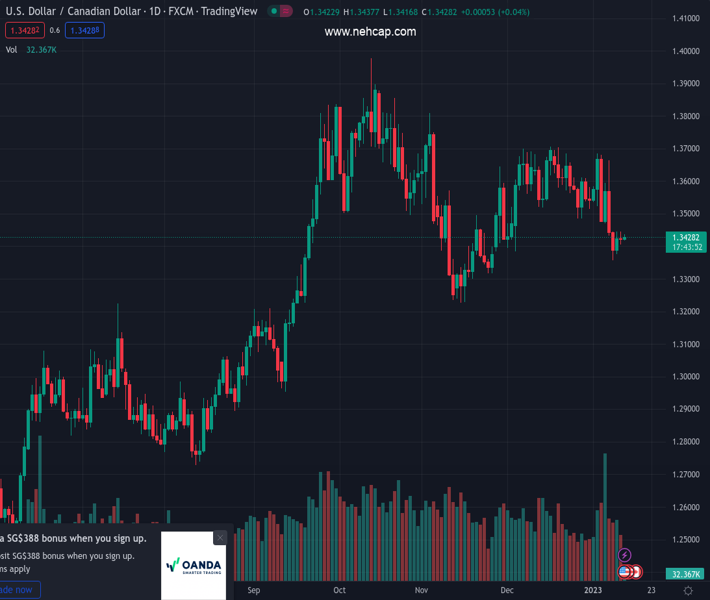
#USDCAD @ 1.34280 is facing hurdles in surpassing the 1.3440 resistance amid lackluster trading activities. (Pivot Orderbook analysis)
…
This is a premium post.
[s2If !current_user_can(access_s2member_level4)]Please register for PREMIUM VERSION HERE to read full post below containing analysis. In case of any error or you think you are not able to read the full post below, please email us at support#nehcap.com [lwa][/s2If] [s2If current_user_can(access_s2member_level4)]
- USD/CAD is facing hurdles in surpassing the 1.3440 resistance amid lackluster trading activities.
- The Lonnie asset is following the footprints of the US Dollar Index, which has turned sideways ahead of US inflation.
- The street is expecting further softening of the US price index led by declining gasoline prices.
The pair currently trades last at 1.34280.
The previous day high was 1.3445 while the previous day low was 1.3404. The daily 38.2% Fib levels comes at 1.343, expected to provide resistance. Similarly, the daily 61.8% fib level is at 1.342, expected to provide support.
The USD/CAD pair is displaying a sideways auction in a 1.3404-1.3440 range in the Asian session. The Loonie asset is unable to find any direction as investors have restricted themselves from building potential positions till the release of the United States inflation data. Also, the major is following the footprints of the US Dollar Index (DXY).
The US Dollar Index has shifted its auction profile below 102.80 as investors are surrendering the safe-haven assets amid rising expectations for further softening of the Consumer Price Index (CPI). The USD Index is weighing down by the rising demand for US Treasury bonds. This has led to a fall in the 10-year US Treasury yields to 3.52%. Meanwhile, the risk profile still seems positive as the S&P500 futures are showing a marginal fall after two back-to-back bullish trading sessions.
It is highly likely that the release of the US inflation data will result in a power-pack action in the FX domain. Considering the consensus, the US, inflation is clearly on the retreat. From its peak of 9.1% in June, the YoY rate most recently fell to 7.1% in November. For December, we forecast a further decline to 6.4%. Used car prices are likely to have fallen by almost 3% in December from November, as reported by Commerzbank. Also, the Core inflation rate to decrease from 6.0% to 5.6%.
Further softening of the US price index will force the Federal Reserve (Fed) to pen down its monetary policy blueprint again, which will release in the first week of February. It might force Fed chair Jerome Powell to look for a smaller interest rate hike in their long-time fight against stubborn inflation.
On the oil front, oil prices have soared vertically to near $78.00 as the Chinese economy is reopening at a sheer pace of scale. This has led to an upward revision of Gross Domestic Product (GDP) projections for the Chinese economy. It is worth noting that Canada is a leading exporter of oil to the United States and higher oil prices might support the Canadian Dollar.
Technical Levels: Supports and Resistances
USDCAD currently trading at 1.3426 at the time of writing. Pair opened at 1.3427 and is trading with a change of -0.01 % .
| Overview | Overview.1 | |
|---|---|---|
| 0 | Today last price | 1.3426 |
| 1 | Today Daily Change | -0.0001 |
| 2 | Today Daily Change % | -0.0100 |
| 3 | Today daily open | 1.3427 |
The pair is trading below its 20 Daily moving average @ 1.3563, below its 50 Daily moving average @ 1.3507 , below its 100 Daily moving average @ 1.3488 and above its 200 Daily moving average @ 1.3161
| Trends | Trends.1 | |
|---|---|---|
| 0 | Daily SMA20 | 1.3563 |
| 1 | Daily SMA50 | 1.3507 |
| 2 | Daily SMA100 | 1.3488 |
| 3 | Daily SMA200 | 1.3161 |
The previous day high was 1.3445 while the previous day low was 1.3404. The daily 38.2% Fib levels comes at 1.343, expected to provide resistance. Similarly, the daily 61.8% fib level is at 1.342, expected to provide support.
Note the levels of interest below:
- Pivot support is noted at 1.3406, 1.3385, 1.3366
- Pivot resistance is noted at 1.3447, 1.3466, 1.3487
| Levels | Levels.1 |
|---|---|
| Previous Daily High | 1.3445 |
| Previous Daily Low | 1.3404 |
| Previous Weekly High | 1.3685 |
| Previous Weekly Low | 1.3433 |
| Previous Monthly High | 1.3705 |
| Previous Monthly Low | 1.3385 |
| Daily Fibonacci 38.2% | 1.3430 |
| Daily Fibonacci 61.8% | 1.3420 |
| Daily Pivot Point S1 | 1.3406 |
| Daily Pivot Point S2 | 1.3385 |
| Daily Pivot Point S3 | 1.3366 |
| Daily Pivot Point R1 | 1.3447 |
| Daily Pivot Point R2 | 1.3466 |
| Daily Pivot Point R3 | 1.3487 |
[/s2If]
Join Our Telegram Group
")


