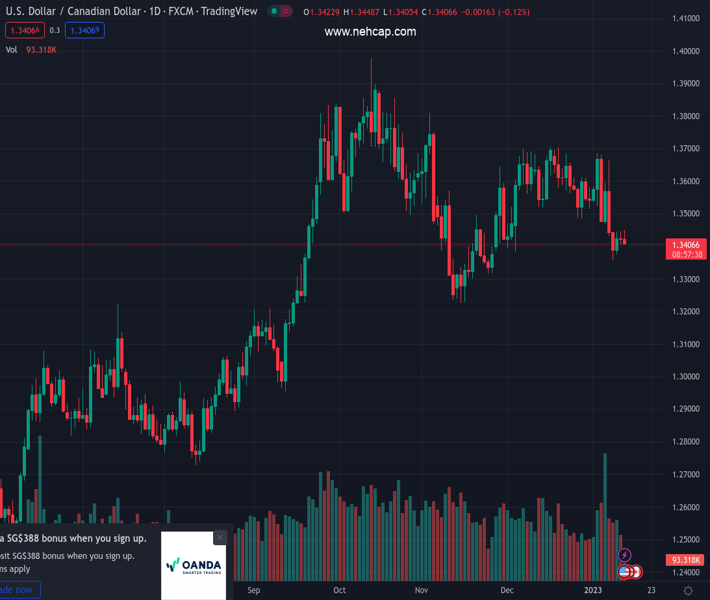
#USDCAD @ 1.34091 surrenders its modest intraday gains and is pressured by a combination of factors. (Pivot Orderbook analysis)
…
This is a premium post.
[s2If !current_user_can(access_s2member_level4)]Please register for PREMIUM VERSION HERE to read full post below containing analysis. In case of any error or you think you are not able to read the full post below, please email us at support#nehcap.com [lwa][/s2If] [s2If current_user_can(access_s2member_level4)]
- USD/CAD surrenders its modest intraday gains and is pressured by a combination of factors.
- Rising oil prices underpin the Loonie and exert some pressure amid sustained USD selling.
- Investors now look forward to the crucial US CPI report before placing fresh directional bets.
The pair currently trades last at 1.34091.
The previous day high was 1.3445 while the previous day low was 1.3404. The daily 38.2% Fib levels comes at 1.343, expected to provide resistance. Similarly, the daily 61.8% fib level is at 1.342, expected to provide resistance.
The USD/CAD pair struggles to capitalize on its modest intraday gains and attracts some sellers in the vicinity of mid-1.3400s, or a fresh weekly high touched earlier this Thursday. The pair slides to the lower end of its daily trading range, though manages to hold above the 1.3400 mark heading into the North American session.
Crude oil prices scale higher for the second successive day amid the latest optimism over China’s pivot away from its zero-COVID policy, which is expected to boost fuel demand. This, in turn, underpins the commodity-linked Loonie, which, along with the prevalent US Dollar selling bias, acts as a headwind for the USD/CAD pair.
In fact, the USD Index, which measures the greenback’s performance against a basket of currencies, languishes near a seven-month low amid rising bets for a less aggressive policy tightening by the Fed. Investors now seem convinced that the Fed will soften its hawkish stance amid initial signs of easing inflationary pressures.
The prospects for smaller Fed rate hikes going forward keep the US Treasury bond yields depressed near a multi-week low and continue to weigh on the greenback. Apart from this, a generally positive tone around the equity markets and a strong pickup in demand for the JPY contribute to driving flows away from the safe-haven buck.
Market participants now look forward to the release of the US consumer inflation figures, which will play a key role in influencing the Fed’s rate hike path. This, in turn, should drive the USD demand. Apart from this, oil price dynamics will be looked upon for some meaningful trading opportunities around the USD/CAD pair.
Technical Levels: Supports and Resistances
USDCAD currently trading at 1.3422 at the time of writing. Pair opened at 1.3427 and is trading with a change of -0.04 % .
| Overview | Overview.1 | |
|---|---|---|
| 0 | Today last price | 1.3422 |
| 1 | Today Daily Change | -0.0005 |
| 2 | Today Daily Change % | -0.0400 |
| 3 | Today daily open | 1.3427 |
The pair is trading below its 20 Daily moving average @ 1.3563, below its 50 Daily moving average @ 1.3507 , below its 100 Daily moving average @ 1.3488 and above its 200 Daily moving average @ 1.3161
| Trends | Trends.1 | |
|---|---|---|
| 0 | Daily SMA20 | 1.3563 |
| 1 | Daily SMA50 | 1.3507 |
| 2 | Daily SMA100 | 1.3488 |
| 3 | Daily SMA200 | 1.3161 |
The previous day high was 1.3445 while the previous day low was 1.3404. The daily 38.2% Fib levels comes at 1.343, expected to provide resistance. Similarly, the daily 61.8% fib level is at 1.342, expected to provide resistance.
Note the levels of interest below:
- Pivot support is noted at 1.3406, 1.3385, 1.3366
- Pivot resistance is noted at 1.3447, 1.3466, 1.3487
| Levels | Levels.1 |
|---|---|
| Previous Daily High | 1.3445 |
| Previous Daily Low | 1.3404 |
| Previous Weekly High | 1.3685 |
| Previous Weekly Low | 1.3433 |
| Previous Monthly High | 1.3705 |
| Previous Monthly Low | 1.3385 |
| Daily Fibonacci 38.2% | 1.3430 |
| Daily Fibonacci 61.8% | 1.3420 |
| Daily Pivot Point S1 | 1.3406 |
| Daily Pivot Point S2 | 1.3385 |
| Daily Pivot Point S3 | 1.3366 |
| Daily Pivot Point R1 | 1.3447 |
| Daily Pivot Point R2 | 1.3466 |
| Daily Pivot Point R3 | 1.3487 |
[/s2If]
Join Our Telegram Group
")


