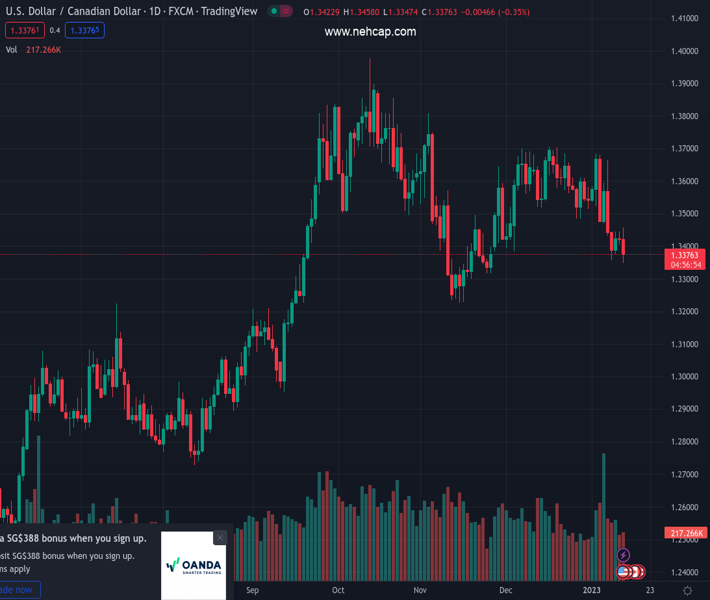
#USDCAD @ 1.33759 drops towards fresh seven-week lows around 1.3340s after US CPI data. (Pivot Orderbook analysis)
…
This is a premium post.
[s2If !current_user_can(access_s2member_level4)]Please register for PREMIUM VERSION HERE to read full post below containing analysis. In case of any error or you think you are not able to read the full post below, please email us at support#nehcap.com [lwa][/s2If] [s2If current_user_can(access_s2member_level4)]
- USD/CAD drops towards fresh seven-week lows around 1.3340s after US CPI data.
- US CPI was lower than expected, while Initial Jobless Claims continued to show a robust labor market.
- The US Dollar continued to weaken across the board, dropping to 6.5-month lows.
The pair currently trades last at 1.33759.
The previous day high was 1.3445 while the previous day low was 1.3404. The daily 38.2% Fib levels comes at 1.343, expected to provide resistance. Similarly, the daily 61.8% fib level is at 1.342, expected to provide resistance.
USD/CAD erases some of its losses spurred by a cooler-than-expected US inflation report that dragged the major towards its current weekly low of 1.3347, though it has recovered some ground at the time of typing. Hence, the USD/CAD is trading at 1.3397, below its opening price by 0.34%.
US equities wobbled following the release of US inflation data. The US Bureau of Labor Statistics (BLS) revealed the Consumer Price Index (CPI) for December ticked lower at -0.1% MoM, below estimates of 0%, while annually based dropped to 6.5% from November’s 7.1%. The so-called core CPI, which excludes volatile items like food and energy, was aligned with estimates of 0.3% MoM, while year-over-year data dipped to 5.7% YoY, below the 6% foreseen.
After the headline crossed newswires, the US Dollar (USD) tumbled across the board due to growing speculations that the Federal Reserve further slowdown the pace of interest rate hikes. Therefore, the USD/CAD dived toward its daily/weekly low at 1.3350
At the same time, the Bureau of Labor Statistics (BLS) revealed that Initial Jobless Claims for the last week came softer at 205K, less than the 215K petitions expected by analysts, showing the labor market resilience.
Elsewhere, Philadelphia’s Fed President Patrick Harker said that 25 bps would be appropriate going forward after the release of the US CPI report. Harker commented that the time for super-size rate hikes has passed and expects a few more rate increases this year.
Technical Levels: Supports and Resistances
USDCAD currently trading at 1.339 at the time of writing. Pair opened at 1.3427 and is trading with a change of -0.28 % .
| Overview | Overview.1 | |
|---|---|---|
| 0 | Today last price | 1.3390 |
| 1 | Today Daily Change | -0.0037 |
| 2 | Today Daily Change % | -0.2800 |
| 3 | Today daily open | 1.3427 |
The pair is trading below its 20 Daily moving average @ 1.3563, below its 50 Daily moving average @ 1.3507 , below its 100 Daily moving average @ 1.3488 and above its 200 Daily moving average @ 1.3161
| Trends | Trends.1 | |
|---|---|---|
| 0 | Daily SMA20 | 1.3563 |
| 1 | Daily SMA50 | 1.3507 |
| 2 | Daily SMA100 | 1.3488 |
| 3 | Daily SMA200 | 1.3161 |
The previous day high was 1.3445 while the previous day low was 1.3404. The daily 38.2% Fib levels comes at 1.343, expected to provide resistance. Similarly, the daily 61.8% fib level is at 1.342, expected to provide resistance.
Note the levels of interest below:
- Pivot support is noted at 1.3406, 1.3385, 1.3366
- Pivot resistance is noted at 1.3447, 1.3466, 1.3487
| Levels | Levels.1 |
|---|---|
| Previous Daily High | 1.3445 |
| Previous Daily Low | 1.3404 |
| Previous Weekly High | 1.3685 |
| Previous Weekly Low | 1.3433 |
| Previous Monthly High | 1.3705 |
| Previous Monthly Low | 1.3385 |
| Daily Fibonacci 38.2% | 1.3430 |
| Daily Fibonacci 61.8% | 1.3420 |
| Daily Pivot Point S1 | 1.3406 |
| Daily Pivot Point S2 | 1.3385 |
| Daily Pivot Point S3 | 1.3366 |
| Daily Pivot Point R1 | 1.3447 |
| Daily Pivot Point R2 | 1.3466 |
| Daily Pivot Point R3 | 1.3487 |
[/s2If]
Join Our Telegram Group
")


