#NZDUSD @ 0.63940 retreats from one-month high even as market sentiment remains firmers. (Pivot Orderbook analysis)
…
This is a premium post.
[s2If !current_user_can(access_s2member_level4)]Please register for PREMIUM VERSION HERE to read full post below containing analysis. In case of any error or you think you are not able to read the full post below, please email us at support#nehcap.com [lwa][/s2If] [s2If current_user_can(access_s2member_level4)]
- NZD/USD retreats from one-month high even as market sentiment remains firmers.
- Softer US inflation fuelled calls for slower rate hikes even as Fed policymakers tried to defend restrictive monetary policy.
- Expectations of easy RBNZ move seem to weigh on Kiwi pair amid light calendar at home.
- China trade numbers for December, preliminary readings of US Michigan CSI for January eyed for fresh impulse.
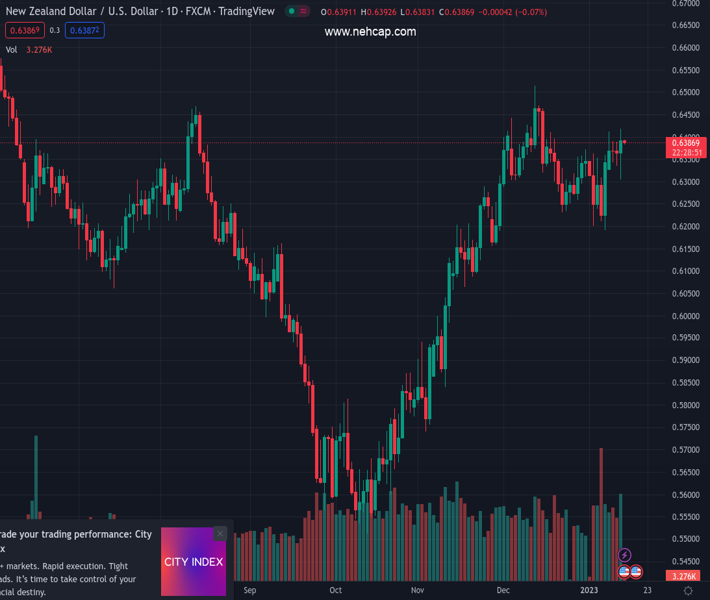
The pair currently trades last at 0.63940.
The previous day high was 0.6401 while the previous day low was 0.6335. The daily 38.2% Fib levels comes at 0.636, expected to provide support. Similarly, the daily 61.8% fib level is at 0.6376, expected to provide support.
NZD/USD prints mild losses around 0.6390-85 as it consolidates the US inflation-led gains during a sluggish Asian session on early Friday. In doing so, the Kiwi pair also portrays the traders’ anxiety ahead of China’s trade numbers for December and the first prints of the US Michigan Consumer Sentiment Index (CSI) for January.
It’s worth noting that the softer US Consumer Price Index (CPI) for December propelled expectations of easy rate hikes and drowned the US Dollar the previous day. However, the recent chatters that the Fed’s easy move could also push the Reserve Bank of New Zealand (RBNZ) to retreat from hawkish bias seemed to have weighed on the NZD/USD prices.
That said, the US CPI matched 6.5% YoY forecasts for December, versus 7.1% prior. More importantly, CPI ex Food & Energy also proved the market consensus of 5.7% YoY figure right, compared to 6.0% previous readings. It’s worth noting that the CPI MoM marked the first negative figure since June 2020 while marking a -0.1% figure for the stated month, versus 0.0% forecast and 0.1% prior.
After the CPI announcements, the Fed Fund Futures tied to the policy rate implied a nearly 100% chance of a 0.25% Fed rate hike in February while the odds favoring a 50 bps rate hike in the said month slumped to 8.0%.
It should be noted that Federal Reserve Bank of Philadelphia President Patrick Harker was the first to flag easy rate hikes after the US CPI and weighed on the US Dollar. On the same line, Richmond Federal Reserve President Thomas Barkin mentioned that it “makes sense” to steer more deliberately as the Fed works to bring inflation down. However, St. Louis Federal Reserve leader James Bullard also said that the most likely scenario is inflation remaining above 2%, so the policy rate will need to be higher for longer.
Amid these plays, Wall Street managed to close in the green while the US 10-year and two-year Treasury bond yields refreshed monthly lows. It should be noted that the S&P 500 Futures print mild gains while the US 10-year Treasury yields remain pressured around 3.44% at the latest.
Given the lack of major data/events at home, NZD/USD may remain sidelined ahead of the key statistics from China and the US. Should the scheduled figures manage to impress policy hawks in Beijing and Washington, the Kiwi pair could extend the latest weakness.
Although a two-week-old ascending trend line restricts the immediate upside of the NZD/USD pair around 0.6440, sellers need validation from the 21-DMA level of 0.6333 to take entries.
Technical Levels: Supports and Resistances
NZDUSD currently trading at 0.6385 at the time of writing. Pair opened at 0.6366 and is trading with a change of 0.30% % .
| Overview | Overview.1 | |
|---|---|---|
| 0 | Today last price | 0.6385 |
| 1 | Today Daily Change | 0.0019 |
| 2 | Today Daily Change % | 0.30% |
| 3 | Today daily open | 0.6366 |
The pair remains strongly bullish on the daily timeframe. It trades above its 20 SMA @ 0.632, 50 SMA 0.6246, 100 SMA @ 0.6045 and 200 SMA @ 0.6216.
| Trends | Trends.1 | |
|---|---|---|
| 0 | Daily SMA20 | 0.6320 |
| 1 | Daily SMA50 | 0.6246 |
| 2 | Daily SMA100 | 0.6045 |
| 3 | Daily SMA200 | 0.6216 |
The previous day high was 0.6401 while the previous day low was 0.6335. The daily 38.2% Fib levels comes at 0.636, expected to provide support. Similarly, the daily 61.8% fib level is at 0.6376, expected to provide support.
Note the levels of interest below:
- Pivot support is noted at 0.6333, 0.6301, 0.6267
- Pivot resistance is noted at 0.64, 0.6433, 0.6466
| Levels | Levels.1 |
|---|---|
| Previous Daily High | 0.6401 |
| Previous Daily Low | 0.6335 |
| Previous Weekly High | 0.6363 |
| Previous Weekly Low | 0.6190 |
| Previous Monthly High | 0.6514 |
| Previous Monthly Low | 0.6230 |
| Daily Fibonacci 38.2% | 0.6360 |
| Daily Fibonacci 61.8% | 0.6376 |
| Daily Pivot Point S1 | 0.6333 |
| Daily Pivot Point S2 | 0.6301 |
| Daily Pivot Point S3 | 0.6267 |
| Daily Pivot Point R1 | 0.6400 |
| Daily Pivot Point R2 | 0.6433 |
| Daily Pivot Point R3 | 0.6466 |
[/s2If]
Join Our Telegram Group
")


