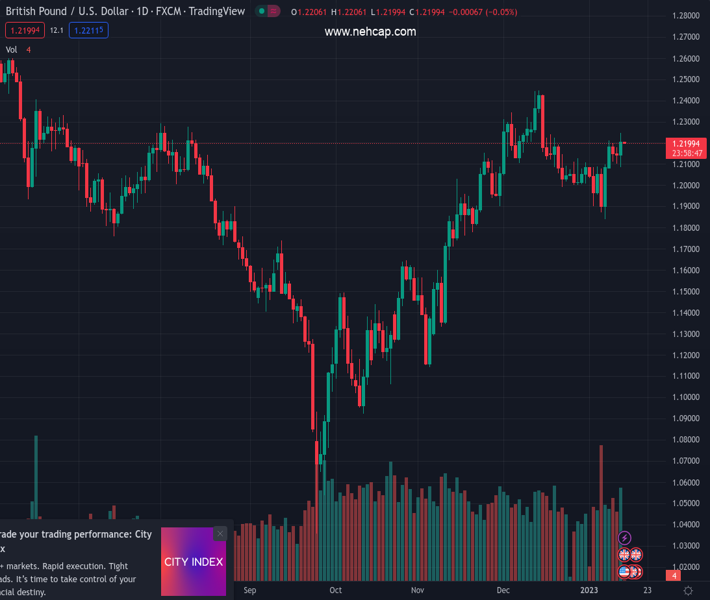
#GBPUSD @ 1.22060 reclaimed two daily moving averages, the confluence of the 20 and 200-day EMAs. (Pivot Orderbook analysis)
…
This is a premium post.
[s2If !current_user_can(access_s2member_level4)]Please register for PREMIUM VERSION HERE to read full post below containing analysis. In case of any error or you think you are not able to read the full post below, please email us at support#nehcap.com [lwa][/s2If] [s2If current_user_can(access_s2member_level4)]
- GBP/USD reclaimed two daily moving averages, the confluence of the 20 and 200-day EMAs.
- A daily close of the GBP/USD above the 200-day EMA could open the door for further gains.
- Otherwise, the GBP/USD would be exposed to selling pressure, which might tumble to the 50-day EMA.
The pair currently trades last at 1.22060.
The previous day high was 1.2179 while the previous day low was 1.21. The daily 38.2% Fib levels comes at 1.213, expected to provide support. Similarly, the daily 61.8% fib level is at 1.2149, expected to provide support.
The GBP/USD soars above 1.2200, snapping two-consecutive days of losses, and gains 0.48%, as Wall Street finished Thursday’s session in the green. Therefore, the GBP/USD is trading at 1.2215, above its opening price, after hitting a daily low of 1.2084.
Thursday’s session witnessed the GBP/USD bouncing off the confluence of the 20 and 200-day Exponential Moving Averages (EMA) around 1.2095/1.2109, late in the New York session. Although a break of the 200-day EMA is supposed to shift the bias of an asset, at least three daily closes would cement the previously mentioned. Also, as long as the GBP/USD stays below last month’s high of 1.2443, the major would be exposed to some selling pressure.
Oscillators like the Relative Strength Index (RSI) remain in bullish territory, poised for further upside, while the Rate of Change (RoC) confirms volatility levels remain depressed.
If the GBP/USD would resume its uptrend, firstly needs to clear the 1.2300 figure. Once done, the next test would be the 1.2400. As an alternate scenario, if the GBP/USD dives below the 20-day EMA at 1.2094, that will put in play the 50-day EMA at 1.1987, but firstly, sellers will need to reclaim 1.2000.
Technical Levels: Supports and Resistances
GBPUSD currently trading at 1.2217 at the time of writing. Pair opened at 1.2146 and is trading with a change of 0.58 % .
| Overview | Overview.1 | |
|---|---|---|
| 0 | Today last price | 1.2217 |
| 1 | Today Daily Change | 0.0071 |
| 2 | Today Daily Change % | 0.5800 |
| 3 | Today daily open | 1.2146 |
The pair remains strongly bullish on the daily timeframe. It trades above its 20 SMA @ 1.2082, 50 SMA 1.1999, 100 SMA @ 1.168 and 200 SMA @ 1.2005.
| Trends | Trends.1 | |
|---|---|---|
| 0 | Daily SMA20 | 1.2082 |
| 1 | Daily SMA50 | 1.1999 |
| 2 | Daily SMA100 | 1.1680 |
| 3 | Daily SMA200 | 1.2005 |
The previous day high was 1.2179 while the previous day low was 1.21. The daily 38.2% Fib levels comes at 1.213, expected to provide support. Similarly, the daily 61.8% fib level is at 1.2149, expected to provide support.
Note the levels of interest below:
- Pivot support is noted at 1.2105, 1.2064, 1.2027
- Pivot resistance is noted at 1.2183, 1.222, 1.2261
| Levels | Levels.1 |
|---|---|
| Previous Daily High | 1.2179 |
| Previous Daily Low | 1.2100 |
| Previous Weekly High | 1.2102 |
| Previous Weekly Low | 1.1841 |
| Previous Monthly High | 1.2447 |
| Previous Monthly Low | 1.1992 |
| Daily Fibonacci 38.2% | 1.2130 |
| Daily Fibonacci 61.8% | 1.2149 |
| Daily Pivot Point S1 | 1.2105 |
| Daily Pivot Point S2 | 1.2064 |
| Daily Pivot Point S3 | 1.2027 |
| Daily Pivot Point R1 | 1.2183 |
| Daily Pivot Point R2 | 1.2220 |
| Daily Pivot Point R3 | 1.2261 |
[/s2If]
Join Our Telegram Group
")


