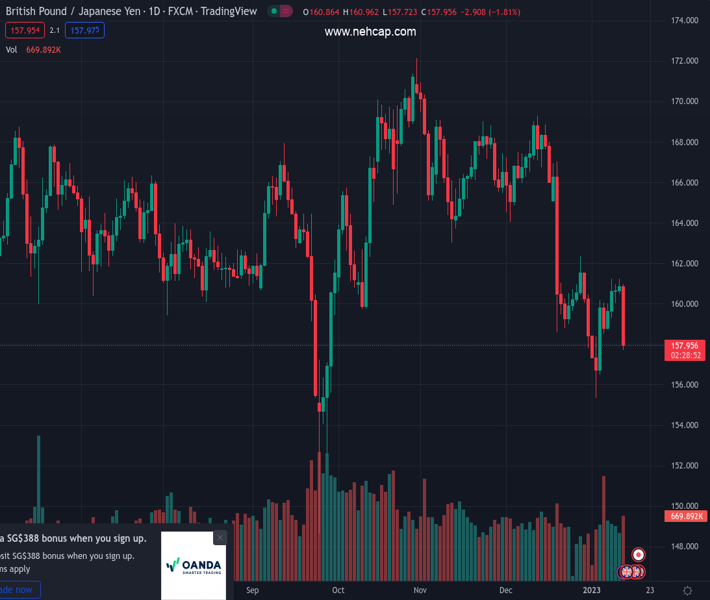
#GBPJPY @ 157.995 collapsed at the confluence of two resistance levels, around 161.00. (Pivot Orderbook analysis)
…
This is a premium post.
[s2If !current_user_can(access_s2member_level4)]Please register for PREMIUM VERSION HERE to read full post below containing analysis. In case of any error or you think you are not able to read the full post below, please email us at support#nehcap.com [lwa][/s2If] [s2If current_user_can(access_s2member_level4)]
- GBP/JPY collapsed at the confluence of two resistance levels, around 161.00.
- GBP/JPY Price Analysis Remains downward biased, and it could test 155.00 once it reclaims the YTD low of 155.35.
The pair currently trades last at 157.995.
The previous day high was 161.22 while the previous day low was 160.51. The daily 38.2% Fib levels comes at 160.95, expected to provide resistance. Similarly, the daily 61.8% fib level is at 160.78, expected to provide resistance.
The GBP/JPY dropped to fresh weekly lows of 157.72 after a cooler-than-expected US inflation report, which spurred safe-haven flows in the FX space amidst an upbeat market sentiment. From a technical perspective, the GBP/JPY stalled around the 20-day Exponential Moving Average (EMA) at 160.75 and dropped some 300 pips. The GBP/JPY is trading at around 158.00
From a daily chart perspective, the GBP/JPY remains downward biased. After registering four days of successive days trading with gains, a fundamental news catalyst and solid resistance at the 20-day EMA around 160.75 triggered a fall. Oscillators like the Relative Strength Index (RSI) at bearish territory and continuing to aim lower support a possible test of YTD lows of 155.36. Also, the Rate of Change (RoC) shows that volatility has not picked up yet, which could refrain traders from opening new shorts positions in the GBP/JPY pair.
However, if the GBP/JPY continued to fall, its next support would be 157.00. A breach of the latter will expose the January 4 daily low of 156.49, followed by the YTD low of 155.35, and then the September 22 low of 152.54.
On the flip side, the GBP/JPY first resistance would be the January 4 daily high of 160.16, followed by the 20-day EMA at 160.76, and then the current week’s high of 161.21.
Technical Levels: Supports and Resistances
GBPJPY currently trading at 157.96 at the time of writing. Pair opened at 160.98 and is trading with a change of -1.88 % .
| Overview | Overview.1 | |
|---|---|---|
| 0 | Today last price | 157.96 |
| 1 | Today Daily Change | -3.02 |
| 2 | Today Daily Change % | -1.88 |
| 3 | Today daily open | 160.98 |
The pair remains strongly bearish on the daily time frame. It trades below the 20 SMA @ 160.84, 50 SMA 164.37, 100 SMA @ 164.27 and 200 SMA @ 163.7.
| Trends | Trends.1 | |
|---|---|---|
| 0 | Daily SMA20 | 160.84 |
| 1 | Daily SMA50 | 164.37 |
| 2 | Daily SMA100 | 164.27 |
| 3 | Daily SMA200 | 163.70 |
The previous day high was 161.22 while the previous day low was 160.51. The daily 38.2% Fib levels comes at 160.95, expected to provide resistance. Similarly, the daily 61.8% fib level is at 160.78, expected to provide resistance.
Note the levels of interest below:
- Pivot support is noted at 160.59, 160.2, 159.88
- Pivot resistance is noted at 161.3, 161.61, 162.0
| Levels | Levels.1 |
|---|---|
| Previous Daily High | 161.22 |
| Previous Daily Low | 160.51 |
| Previous Weekly High | 160.18 |
| Previous Weekly Low | 155.36 |
| Previous Monthly High | 169.28 |
| Previous Monthly Low | 157.84 |
| Daily Fibonacci 38.2% | 160.95 |
| Daily Fibonacci 61.8% | 160.78 |
| Daily Pivot Point S1 | 160.59 |
| Daily Pivot Point S2 | 160.20 |
| Daily Pivot Point S3 | 159.88 |
| Daily Pivot Point R1 | 161.30 |
| Daily Pivot Point R2 | 161.61 |
| Daily Pivot Point R3 | 162.00 |
[/s2If]
Join Our Telegram Group
")


