#EURUSD @ 1.07636 stays firmer around seven-month high, approaching mid-2022 top., @nehcap view: Limited upside expected (Pivot Orderbook analysis)
…
This is a premium post.
[s2If !current_user_can(access_s2member_level4)]Please register for PREMIUM VERSION HERE to read full post below containing analysis. In case of any error or you think you are not able to read the full post below, please email us at support#nehcap.com [lwa][/s2If] [s2If current_user_can(access_s2member_level4)]
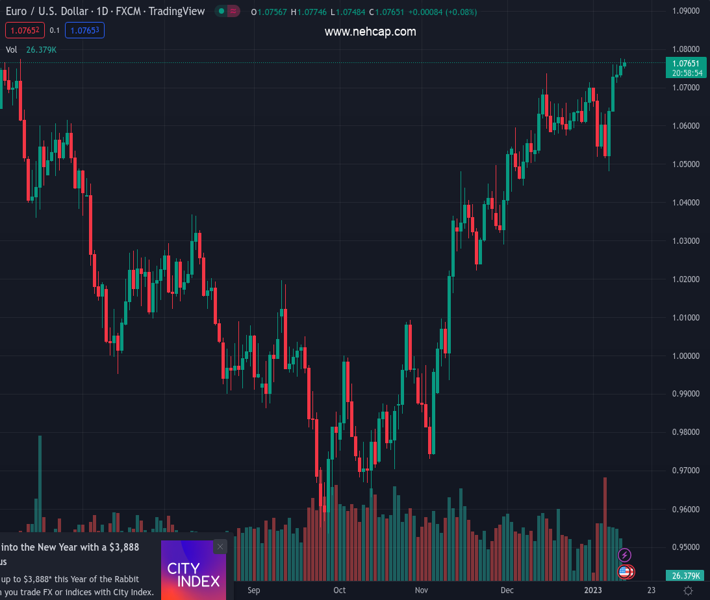
- EUR/USD stays firmer around seven-month high, approaching mid-2022 top.
- Nearly overbought RSI challenges buyers as they brace for key hurdles.
- Looming bull cross on MACD, clear upside break of one-month-old descending trend line favor bulls.
- EUR/USD buyers can aim for ascending trend line from mid-November on crossing 1.0805.
The pair currently trades last at 1.07636.
The previous day high was 1.0776 while the previous day low was 1.0726. The daily 38.2% Fib levels comes at 1.0757, expected to provide support. Similarly, the daily 61.8% fib level is at 1.0745, expected to provide support.
EUR/USD bulls take a breather around the highest levels since June 2022, marked the previous day, as they brace for the key US Consumer Price Index (CPI) data for December during early Thursday. In doing so, the major currency pair prints mild gains around 1.0775 by the press time.
A successful break of a descending trend line from December 15, 2022, around 1.0685 by the press time, joins the looming bull cross on the MACD to keep buyers hopeful. However, the RSI (14) line is near the overbought conditions and suggests limited upside room for the pair.
As a result, the May 2022 peak of 1.0786 appears a major challenge for the EUR/USD bulls, a break of which will highlight the March 2022 bottom surrounding 1.0805 as the next key hurdle for the upside momentum.
In a case where the EUR/USD pair manage to remain firmer past 1.0805, the odds of witnessing a run-up towards a two-month-old ascending resistance line, close to 1.0965 at the latest, can’t be ruled out.
On the flip side, pullback moves may initially aim for a December 2022 high of 1.0736 before resting on the resistance-turned-support line near 1.0685.
In a case where EUR/USD remains bearish past 1.0685, a downward trajectory towards the monthly low of 1.0483 can be witnessed.
Trend: Limited upside expected
Technical Levels: Supports and Resistances
EURUSD currently trading at 1.077 at the time of writing. Pair opened at 1.0754 and is trading with a change of 0.15% % .
| Overview | Overview.1 | |
|---|---|---|
| 0 | Today last price | 1.077 |
| 1 | Today Daily Change | 0.0016 |
| 2 | Today Daily Change % | 0.15% |
| 3 | Today daily open | 1.0754 |
The pair remains strongly bullish on the daily timeframe. It trades above its 20 SMA @ 1.0635, 50 SMA 1.0463, 100 SMA @ 1.0173 and 200 SMA @ 1.0311.
| Trends | Trends.1 | |
|---|---|---|
| 0 | Daily SMA20 | 1.0635 |
| 1 | Daily SMA50 | 1.0463 |
| 2 | Daily SMA100 | 1.0173 |
| 3 | Daily SMA200 | 1.0311 |
The previous day high was 1.0776 while the previous day low was 1.0726. The daily 38.2% Fib levels comes at 1.0757, expected to provide support. Similarly, the daily 61.8% fib level is at 1.0745, expected to provide support.
Note the levels of interest below:
- Pivot support is noted at 1.0728, 1.0701, 1.0677
- Pivot resistance is noted at 1.0778, 1.0803, 1.0829
| Levels | Levels.1 |
|---|---|
| Previous Daily High | 1.0776 |
| Previous Daily Low | 1.0726 |
| Previous Weekly High | 1.0710 |
| Previous Weekly Low | 1.0483 |
| Previous Monthly High | 1.0736 |
| Previous Monthly Low | 1.0393 |
| Daily Fibonacci 38.2% | 1.0757 |
| Daily Fibonacci 61.8% | 1.0745 |
| Daily Pivot Point S1 | 1.0728 |
| Daily Pivot Point S2 | 1.0701 |
| Daily Pivot Point S3 | 1.0677 |
| Daily Pivot Point R1 | 1.0778 |
| Daily Pivot Point R2 | 1.0803 |
| Daily Pivot Point R3 | 1.0829 |
[/s2If]
Join Our Telegram Group
")


