#EURUSD @ 1.07567 retreats from intraday high as bulls take a breather ahead of the key US CPI., @nehcap view: Bullish (Pivot Orderbook analysis)
…
This is a premium post.
[s2If !current_user_can(access_s2member_level4)]Please register for PREMIUM VERSION HERE to read full post below containing analysis. In case of any error or you think you are not able to read the full post below, please email us at support#nehcap.com [lwa][/s2If] [s2If current_user_can(access_s2member_level4)]
- EUR/USD retreats from intraday high as bulls take a breather ahead of the key US CPI.
- 50-HMA, two-week-old horizontal support restrict short-term downside.
- Firmer RSI (14) signals limited acceptance to bearish bias.
The pair currently trades last at 1.07567.
The previous day high was 1.0776 while the previous day low was 1.0726. The daily 38.2% Fib levels comes at 1.0757, expected to provide resistance. Similarly, the daily 61.8% fib level is at 1.0745, expected to provide support.
EUR/USD depicts the market’s cautious mood heading into Thursday’s European session as it eases from an intraday high to 1.0760 by the press time. Even so, the major currency pair remains firmer for the fifth consecutive day as traders await the US Consumer Price Index (CPI) data for December.
That said, the quote’s latest pullback could be linked to its inability in crossing the fortnight-long ascending resistance line, around 1.0780 by the press time.
The lower highs on the RSI (14) also favor the recent pullback in the EUR/USD. However, the momentum indicators remain well above the 50 mark and suggest limited favor to the heavy downside.
Against this backdrop, the EUR/USD sellers approach the 50-HMA support surrounding 1.0745. Though, the quote’s weakness past 1.0745 remains limited as multiple levels marked since December 30 restrict the quote’s further downside around 1.0710.
In a case where EUR/USD breaks the 1.0710 support, a quick drop toward the tops marked late last week, near 1.0635 appears more likely.
Meanwhile, recovery moves need to cross the aforementioned ascending resistance line, close to 1.0780, to restore the bullish bias. Even so, the high marked during May 2022 and the March 2022 low, respectively near 1.0785 and 1.0805, could challenge the EUR/USD buyers.
Following that, a run-up towards the 1.1000 psychological magnet can’t be ruled out.
Trend: Bullish
Technical Levels: Supports and Resistances
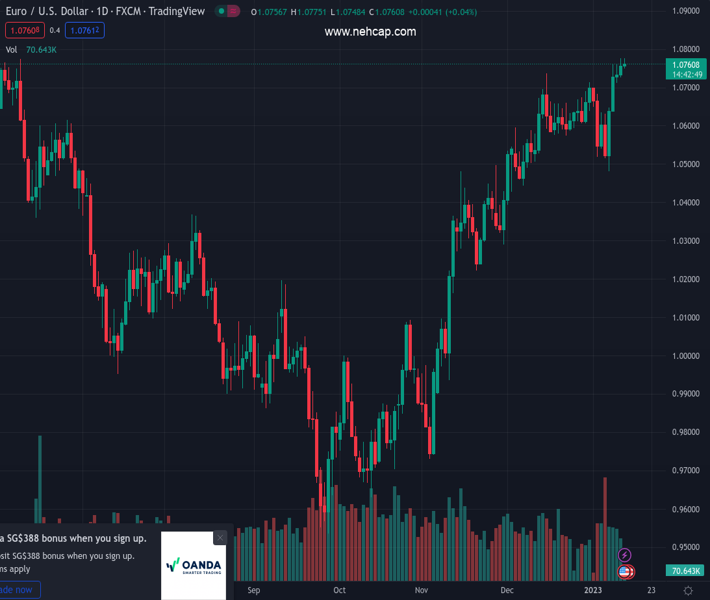
EURUSD currently trading at 1.0761 at the time of writing. Pair opened at 1.0754 and is trading with a change of 0.07% % .
| Overview | Overview.1 | |
|---|---|---|
| 0 | Today last price | 1.0761 |
| 1 | Today Daily Change | 0.0007 |
| 2 | Today Daily Change % | 0.07% |
| 3 | Today daily open | 1.0754 |
The pair remains strongly bullish on the daily timeframe. It trades above its 20 SMA @ 1.0635, 50 SMA 1.0463, 100 SMA @ 1.0173 and 200 SMA @ 1.0311.
| Trends | Trends.1 | |
|---|---|---|
| 0 | Daily SMA20 | 1.0635 |
| 1 | Daily SMA50 | 1.0463 |
| 2 | Daily SMA100 | 1.0173 |
| 3 | Daily SMA200 | 1.0311 |
The previous day high was 1.0776 while the previous day low was 1.0726. The daily 38.2% Fib levels comes at 1.0757, expected to provide resistance. Similarly, the daily 61.8% fib level is at 1.0745, expected to provide support.
Note the levels of interest below:
- Pivot support is noted at 1.0728, 1.0701, 1.0677
- Pivot resistance is noted at 1.0778, 1.0803, 1.0829
| Levels | Levels.1 |
|---|---|
| Previous Daily High | 1.0776 |
| Previous Daily Low | 1.0726 |
| Previous Weekly High | 1.0710 |
| Previous Weekly Low | 1.0483 |
| Previous Monthly High | 1.0736 |
| Previous Monthly Low | 1.0393 |
| Daily Fibonacci 38.2% | 1.0757 |
| Daily Fibonacci 61.8% | 1.0745 |
| Daily Pivot Point S1 | 1.0728 |
| Daily Pivot Point S2 | 1.0701 |
| Daily Pivot Point S3 | 1.0677 |
| Daily Pivot Point R1 | 1.0778 |
| Daily Pivot Point R2 | 1.0803 |
| Daily Pivot Point R3 | 1.0829 |
[/s2If]
Join Our Telegram Group
")


