#AUDUSD @ 0.68921 surrenders modest intraday gains and retreats below the 0.6900 mark in the last hour. (Pivot Orderbook analysis)
…
This is a premium post.
[s2If !current_user_can(access_s2member_level4)]Please register for PREMIUM VERSION HERE to read full post below containing analysis. In case of any error or you think you are not able to read the full post below, please email us at support#nehcap.com [lwa][/s2If] [s2If current_user_can(access_s2member_level4)]
- AUD/USD surrenders modest intraday gains and retreats below the 0.6900 mark in the last hour.
- The cautious market mood lends some support to the safe-haven buck and acts as a headwind.
- Bets for an additional RBA rate hike in February should limit losses ahead of the key US CPI.
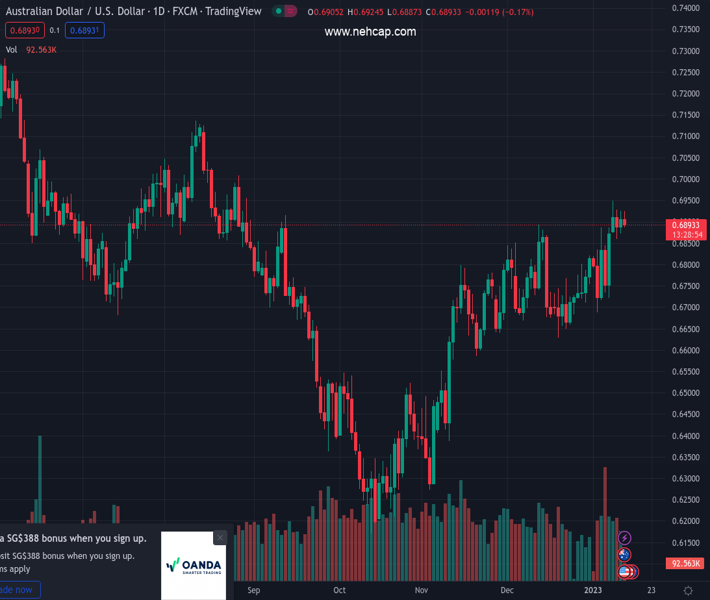
The pair currently trades last at 0.68921.
The previous day high was 0.6926 while the previous day low was 0.6873. The daily 38.2% Fib levels comes at 0.6906, expected to provide resistance. Similarly, the daily 61.8% fib level is at 0.6893, expected to provide resistance.
The AUD/USD pair struggles to capitalize on its modest intraday gains and fails near the 0.6925-0.6930 supply zone for the third straight day on Thursday. Spot prices retreat below the 0.6900 mark during the early part of the European session and refresh the daily low in the last hour, though the downside seems limited.
The Australian Dollar might draw support from rising bets for an additional interest rate hike by the Reserve Bank of Australia (RBA) in February, bolstered by Wednesday’s hotter domestic inflation data. In fact, the Australian Bureau of Statistics reported that the headline Consumer Price Index (CPI) re-accelerated to the 7.3% YoY rate – a 32-year-high – in November from the 6.9% in the previous month. Apart from this, subdued US Dollar price action could act as a tailwind for the AUD/USD pair, at least for the time being.
The USD Index, which measures the greenback’s performance against a basket of currencies, languishes near a multi-month low amid diminishing odds for a more aggressive tightening by the Fed. A slowdown in the US wage growth was seen as the initial sign of easing inflationary pressures, which could allow the US central bank to soften its hawkish stance. This leads to a further decline in the US Treasury bond yields and weighs on the buck. That said, the cautious mood helps limit any further losses for the safe-haven USD.
The anxiety ahead of Thursday’s release of the latest US consumer inflation figures tempers investors’ appetite for perceived riskier assets. This is evident from a softer tone around the equity markets, which is seen benefitting the greenback’s relative safe-haven status and capping the upside for the risk-sensitive Aussie. Hence, the focus remains on the crucial US CPI report, due later during the early North American session.
Technical Levels: Supports and Resistances
AUDUSD currently trading at 0.6889 at the time of writing. Pair opened at 0.6907 and is trading with a change of -0.26 % .
| Overview | Overview.1 | |
|---|---|---|
| 0 | Today last price | 0.6889 |
| 1 | Today Daily Change | -0.0018 |
| 2 | Today Daily Change % | -0.2600 |
| 3 | Today daily open | 0.6907 |
The pair remains strongly bullish on the daily timeframe. It trades above its 20 SMA @ 0.6767, 50 SMA 0.6715, 100 SMA @ 0.6635 and 200 SMA @ 0.6836.
| Trends | Trends.1 | |
|---|---|---|
| 0 | Daily SMA20 | 0.6767 |
| 1 | Daily SMA50 | 0.6715 |
| 2 | Daily SMA100 | 0.6635 |
| 3 | Daily SMA200 | 0.6836 |
The previous day high was 0.6926 while the previous day low was 0.6873. The daily 38.2% Fib levels comes at 0.6906, expected to provide resistance. Similarly, the daily 61.8% fib level is at 0.6893, expected to provide resistance.
Note the levels of interest below:
- Pivot support is noted at 0.6878, 0.6849, 0.6825
- Pivot resistance is noted at 0.6931, 0.6954, 0.6983
| Levels | Levels.1 |
|---|---|
| Previous Daily High | 0.6926 |
| Previous Daily Low | 0.6873 |
| Previous Weekly High | 0.6887 |
| Previous Weekly Low | 0.6688 |
| Previous Monthly High | 0.6893 |
| Previous Monthly Low | 0.6629 |
| Daily Fibonacci 38.2% | 0.6906 |
| Daily Fibonacci 61.8% | 0.6893 |
| Daily Pivot Point S1 | 0.6878 |
| Daily Pivot Point S2 | 0.6849 |
| Daily Pivot Point S3 | 0.6825 |
| Daily Pivot Point R1 | 0.6931 |
| Daily Pivot Point R2 | 0.6954 |
| Daily Pivot Point R3 | 0.6983 |
[/s2If]
Join Our Telegram Group
")


