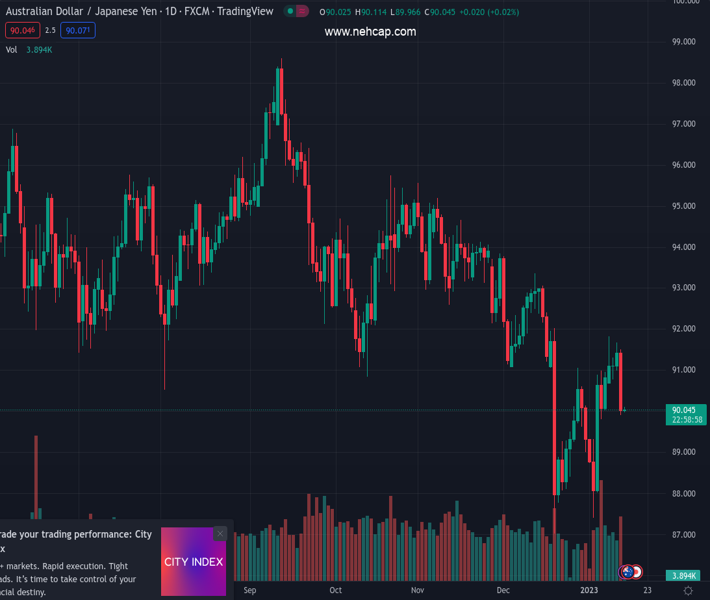
#AUDJPY @ 90.1000 stabilizes around key support zone after falling the most in three weeks., @nehcap view: Further downside expected (Pivot Orderbook analysis)
…
This is a premium post.
[s2If !current_user_can(access_s2member_level4)]Please register for PREMIUM VERSION HERE to read full post below containing analysis. In case of any error or you think you are not able to read the full post below, please email us at support#nehcap.com [lwa][/s2If] [s2If current_user_can(access_s2member_level4)]
- AUD/JPY stabilizes around key support zone after falling the most in three weeks.
- 100-SMA, multiple levels marked in one week carve out 89.85-75 as important support.
- Clear break of 50-SMA, bearish MACD signals favor sellers.
- 50% Fibonacci retracement level guards immediate upside, bulls could regain confidence on breaking 91.00.
The pair currently trades last at 90.1000.
The previous day high was 91.67 while the previous day low was 90.95. The daily 38.2% Fib levels comes at 91.4, expected to provide resistance. Similarly, the daily 61.8% fib level is at 91.22, expected to provide resistance.
AUD/JPY pares the biggest daily loss in three weeks around 90.20 after failing to break the key 89.85-75 support zone the previous day. Even so, the cross-currency pair remains on the bear’s radar during early Friday in Asia.
That said, a downside break of the 50-SMA and the bearish MACD signals keep the quote as the bear’s favorite despite the latest consolidation.
However, a convergence of the 100-SMA and an eight-day-long horizontal support zone, around 89.85-75, appears a tough nut to crack for the AUD/JPY bears before they can extend the ruling.
Also acting as a downside filter is December 22, 2022, low near 89.30 and the 89.00 round figure.
Following that, the monthly low 87.41 and the previous month’s bottom surrounding 87.00 will be in the spotlight.
Alternatively, the 50% Fibonacci retracement level of the pair’s December 13-20 downturn, near 90.20, guards the immediate upside of the AUD/JPY before highlighting the 50-SMA hurdle of 90.35.
Even if the quote manages to stay beyond 90.35, the 61.8% Fibonacci retracement, also known as the “Golden ratio”, could challenge the AUD/JPY bulls around 90.95. It should be noted that the pair buyers may seek confirmation from the 91.00 threshold.
Trend: Further downside expected
Technical Levels: Supports and Resistances
AUDJPY currently trading at 90.14 at the time of writing. Pair opened at 91.53 and is trading with a change of -1.52% % .
| Overview | Overview.1 | |
|---|---|---|
| 0 | Today last price | 90.14 |
| 1 | Today Daily Change | -1.39 |
| 2 | Today Daily Change % | -1.52% |
| 3 | Today daily open | 91.53 |
The pair is trading above its 20 Daily moving average @ 90.07, below its 50 Daily moving average @ 92.0 , below its 100 Daily moving average @ 93.33 and below its 200 Daily moving average @ 93.22
| Trends | Trends.1 | |
|---|---|---|
| 0 | Daily SMA20 | 90.07 |
| 1 | Daily SMA50 | 92.00 |
| 2 | Daily SMA100 | 93.33 |
| 3 | Daily SMA200 | 93.22 |
The previous day high was 91.67 while the previous day low was 90.95. The daily 38.2% Fib levels comes at 91.4, expected to provide resistance. Similarly, the daily 61.8% fib level is at 91.22, expected to provide resistance.
Note the levels of interest below:
- Pivot support is noted at 91.1, 90.66, 90.37
- Pivot resistance is noted at 91.82, 92.11, 92.54
| Levels | Levels.1 |
|---|---|
| Previous Daily High | 91.67 |
| Previous Daily Low | 90.95 |
| Previous Weekly High | 90.99 |
| Previous Weekly Low | 87.41 |
| Previous Monthly High | 93.81 |
| Previous Monthly Low | 87.02 |
| Daily Fibonacci 38.2% | 91.40 |
| Daily Fibonacci 61.8% | 91.22 |
| Daily Pivot Point S1 | 91.10 |
| Daily Pivot Point S2 | 90.66 |
| Daily Pivot Point S3 | 90.37 |
| Daily Pivot Point R1 | 91.82 |
| Daily Pivot Point R2 | 92.11 |
| Daily Pivot Point R3 | 92.54 |
[/s2If]
Join Our Telegram Group
")


