Asian stocks are displaying anxiety as investors await US inflation for fresh impetus. (Pivot Orderbook analysis)
…
This is a premium post.
[s2If !current_user_can(access_s2member_level4)]Please register for PREMIUM VERSION HERE to read full post below containing analysis. In case of any error or you think you are not able to read the full post below, please email us at support#nehcap.com [lwa][/s2If] [s2If current_user_can(access_s2member_level4)]
- Asian stocks are displaying anxiety as investors await US inflation for fresh impetus.
- Weaker-than-projected China’s PPI data may impact equities on expectations of lower operating margins.
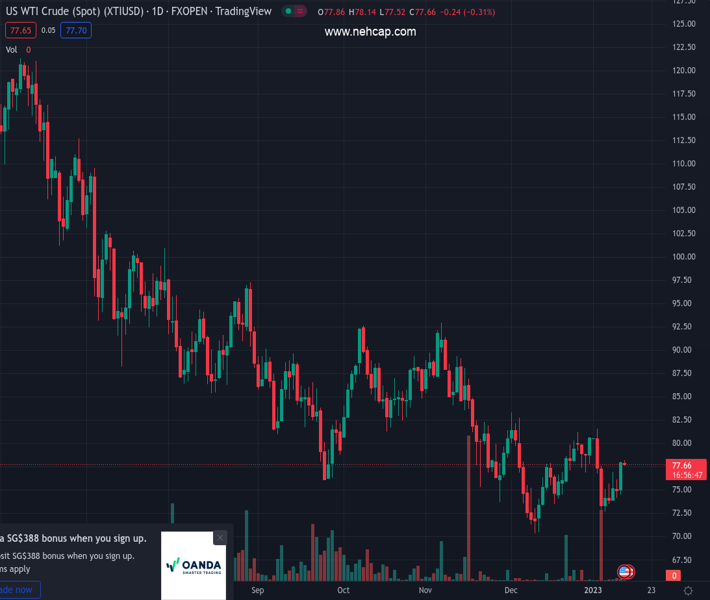
- Oil prices are looking to extend gains above $78.00 on expectations of recovery in China’s growth.
The pair currently trades last at 26577.56.
The previous day high was 26578.67 while the previous day low was 26367.25. The daily 38.2% Fib levels comes at 26497.91, expected to provide support. Similarly, the daily 61.8% fib level is at 26448.01, expected to provide support.
Markets in the Asian domain have turned cautious as investors are awaiting the release of the United States inflation data for fresh cues. This has turned the potential assets sideways as investors are avoiding getting caught in volatile moves before the release. The US Dollar Index (DXY) is facing barricades around 102.80 while S&P500 futures are displaying a subdued performance after two back-to-back bullish trading sessions.
At the press time, Japan’s Nikkei225 trades almost flat, ChinaA50 drops 0.17%, Hang Seng eased 0.12%, and Nifty50 slips 0.20%.
Chinese stocks have also been impacted after the release of the mixed Consumer Price Index (CPI) data. The annual CPI figure has remained in line with the expectations at 1.8% and higher than the former release of 1.6%. While, the price index at the factory gate has dropped sharply, signaling less bargaining power from producers. The Producer Price Index (PPI) has shrunk by 0.7% vs. the expectation of 0.1% contraction. A decline in PPI numbers I expected to impact Chinese equities ahead as lower prices are likely to impact their operating margins.
Meanwhile, Japanese markets are likely to display wild gyrations as the Bank of Japan (BoJ) will review the side-effects of secular period ultra-loose monetary policy managed by the central bank. Japanese officials are considering shifting the paradigm of their monetary policy approach as an exit to easy monetary policy may provide support to the Japanese yen for a longer period.
On the oil front, oil prices are aiming to accelerate gains further above $78.00 amid optimism over a recovery in China’s economic growth led by the reopening of the economy and heavy bets on further softening of the US inflation.
Technical Levels: Supports and Resistances
XTIUSD currently trading at 26577.56 at the time of writing. Pair opened at 26577.56 and is trading with a change of 0.0 % .
| Overview | Overview.1 | |
|---|---|---|
| 0 | Today last price | 26577.56 |
| 1 | Today Daily Change | 0.00 |
| 2 | Today Daily Change % | 0.00 |
| 3 | Today daily open | 26577.56 |
The pair is trading above its 20 Daily moving average @ 26357.76, below its 50 Daily moving average @ 27306.51 , below its 100 Daily moving average @ 27324.8 and below its 200 Daily moving average @ 27229.76
| Trends | Trends.1 | |
|---|---|---|
| 0 | Daily SMA20 | 26357.76 |
| 1 | Daily SMA50 | 27306.51 |
| 2 | Daily SMA100 | 27324.80 |
| 3 | Daily SMA200 | 27229.76 |
The previous day high was 26578.67 while the previous day low was 26367.25. The daily 38.2% Fib levels comes at 26497.91, expected to provide support. Similarly, the daily 61.8% fib level is at 26448.01, expected to provide support.
Note the levels of interest below:
- Pivot support is noted at 26436.98, 26296.41, 26225.56
- Pivot resistance is noted at 26648.4, 26719.25, 26859.82
| Levels | Levels.1 |
|---|---|
| Previous Daily High | 26578.67 |
| Previous Daily Low | 26367.25 |
| Previous Weekly High | 26239.76 |
| Previous Weekly Low | 25549.18 |
| Previous Monthly High | 28325.89 |
| Previous Monthly Low | 25793.22 |
| Daily Fibonacci 38.2% | 26497.91 |
| Daily Fibonacci 61.8% | 26448.01 |
| Daily Pivot Point S1 | 26436.98 |
| Daily Pivot Point S2 | 26296.41 |
| Daily Pivot Point S3 | 26225.56 |
| Daily Pivot Point R1 | 26648.40 |
| Daily Pivot Point R2 | 26719.25 |
| Daily Pivot Point R3 | 26859.82 |
[/s2If]
Join Our Telegram Group
")


