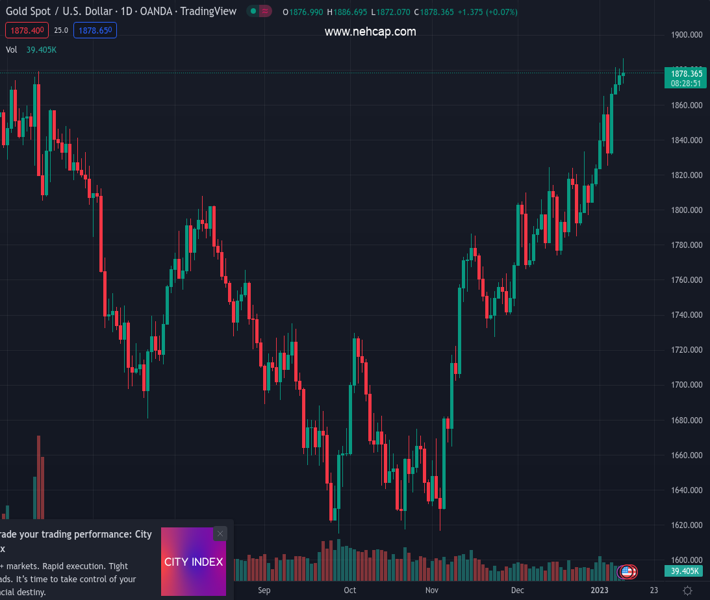
#XAUUSD @ 1,878.29 Gold price struggles to capitalize on its intraday positive move to a fresh multi-month peak. (Pivot Orderbook analysis)
…
This is a premium post.
[s2If !current_user_can(access_s2member_level4)]Please register for PREMIUM VERSION HERE to read full post below containing analysis. In case of any error or you think you are not able to read the full post below, please email us at support#nehcap.com [lwa][/s2If] [s2If current_user_can(access_s2member_level4)]
- Gold price struggles to capitalize on its intraday positive move to a fresh multi-month peak.
- A modest US Dollar strength and a positive risk tone act as a headwind for the commodity.
- Bets for smaller Fed rate hikes help limit losses as the focus remains on the US CPI report.
The pair currently trades last at 1878.29.
The previous day high was 1880.79 while the previous day low was 1867.94. The daily 38.2% Fib levels comes at 1875.88, expected to provide support. Similarly, the daily 61.8% fib level is at 1872.85, expected to provide support.
Gold price surrenders modest intraday gains to a fresh eight-month peak, around the $1,886-$1,887 area touched earlier this Wednesday and turns neutral heading into the North American session. Currently placed just above the $1,875 level, the downside for the XAU/USD remains cushioned amid expectations for a less aggressive policy tightening by the Federal Reserve (Fed).
Friday’s mixed jobs report from the United States (US) showed a slowdown in wage growth and pointed to signs of easing inflationary pressures. Furthermore, business activity in the US services sector hit the worst level since 2009, suggesting that the effect of the Fed’s large rate hikes in 2022 is being felt in the economy. This, in turn, lifted bets for smaller Fed rate hikes going forward, which keeps the US Treasury bond yields depressed near a multi-week low and might continue to lend support to the non-yielding Gold price.
That said, a modest US Dollar (USD) uptick is holding back bullish traders from placing aggressive bets. A stronger Greenback tends to act as a headwind for the US Dollar-denominated Gold price. Apart from this, a generally positive tone around the equity markets further contributes to capping the upside for the safe-haven precious metal, at least for the time being. Traders also seem reluctant and prefer to move to the sidelines ahead of the release of the latest consumer inflation figures from the United States (US), due on Thursday.
The crucial US CPI report will play a key role in influencing the Federal Reserve’s rate-hike path and driving Gold price in the near term. Policymakers have indicated that they remain committed to combat high inflation and that rates could remain elevated for longer, or until there is clear evidence that consumer prices are falling. Hence, a stronger US CPI print will lift bets for a more hawkish Fed and push the XAU/USD back down.
Heading into the key data risk, sliding US bond yields could act as a headwind for the Greenback in the absence of any relevant market-moving economic releases from the US. This might continue to lend some support to the Gold price. Apart from this, traders might take cues from the broader risk sentiment to grab short-term opportunities around the XAU/USD.
From a technical perspective, any meaningful corrective slide is likely to find decent support near the $1,865-$1,860 resistance breakpoint. A sustained break below might prompt some technical selling and drag the Gold price to the $1,835-$1,833 horizontal support. On the flip side, the next level of resistance is pegged near the $1,900 round figure. A sustained strength beyond will be seen as a fresh trigger for bullish traders and pave the way for an extension of the near-term appreciating move.
Technical Levels: Supports and Resistances
XAUUSD currently trading at 1879.15 at the time of writing. Pair opened at 1878.14 and is trading with a change of 0.05 % .
| Overview | Overview.1 | |
|---|---|---|
| 0 | Today last price | 1879.15 |
| 1 | Today Daily Change | 1.01 |
| 2 | Today Daily Change % | 0.05 |
| 3 | Today daily open | 1878.14 |
The pair remains strongly bullish on the daily timeframe. It trades above its 20 SMA @ 1820.22, 50 SMA 1778.04, 100 SMA @ 1729.6 and 200 SMA @ 1777.55.
| Trends | Trends.1 | |
|---|---|---|
| 0 | Daily SMA20 | 1820.22 |
| 1 | Daily SMA50 | 1778.04 |
| 2 | Daily SMA100 | 1729.60 |
| 3 | Daily SMA200 | 1777.55 |
The previous day high was 1880.79 while the previous day low was 1867.94. The daily 38.2% Fib levels comes at 1875.88, expected to provide support. Similarly, the daily 61.8% fib level is at 1872.85, expected to provide support.
Note the levels of interest below:
- Pivot support is noted at 1870.46, 1862.77, 1857.61
- Pivot resistance is noted at 1883.31, 1888.47, 1896.16
| Levels | Levels.1 |
|---|---|
| Previous Daily High | 1880.79 |
| Previous Daily Low | 1867.94 |
| Previous Weekly High | 1869.91 |
| Previous Weekly Low | 1823.76 |
| Previous Monthly High | 1833.38 |
| Previous Monthly Low | 1765.89 |
| Daily Fibonacci 38.2% | 1875.88 |
| Daily Fibonacci 61.8% | 1872.85 |
| Daily Pivot Point S1 | 1870.46 |
| Daily Pivot Point S2 | 1862.77 |
| Daily Pivot Point S3 | 1857.61 |
| Daily Pivot Point R1 | 1883.31 |
| Daily Pivot Point R2 | 1888.47 |
| Daily Pivot Point R3 | 1896.16 |
[/s2If]
Join Our Telegram Group
")


