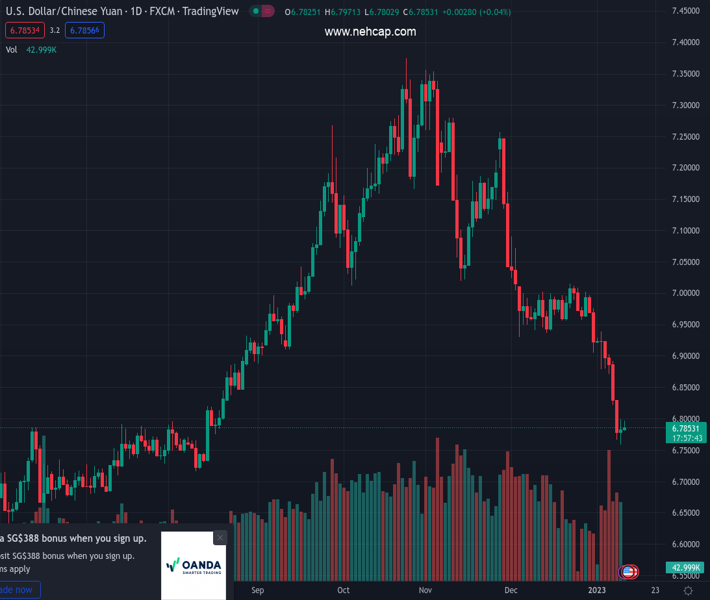
#USDCNH @ 6.78579 Investors are awaiting US/China inflation data for fresh cues. (Pivot Orderbook analysis)
…
This is a premium post.
[s2If !current_user_can(access_s2member_level4)]Please register for PREMIUM VERSION HERE to read full post below containing analysis. In case of any error or you think you are not able to read the full post below, please email us at support#nehcap.com [lwa][/s2If] [s2If current_user_can(access_s2member_level4)]
- Investors are awaiting US/China inflation data for fresh cues.
- The absence of follow-up buying after a Double Bottom formation indicates a lack of strength in the US Dollar.
- Declining 50-EMA adds to the downside filters.
The pair currently trades last at 6.78579.
The previous day high was 6.7992 while the previous day low was 6.7588. The daily 38.2% Fib levels comes at 6.7838, expected to provide support. Similarly, the daily 61.8% fib level is at 6.7743, expected to provide support.
The USD/CNH pair is struggling to extend its recovery move above the critical resistance of 6.8000 in the Asian session. The asset is demonstrating topsy-turvy moves as investors are awaiting the release of the Consumer Price Index (CPI) figures by the United States and China, which are scheduled for Thursday.
The US Dollar Index (DXY) is hovering near the edge of the 103.00 resistance amid a quiet market mood. Also, S&P500 futures are displaying a subdued performance as anxiety soars ahead of inflation data.
On an hourly scale, the major picked strength after forming a Double Bottom chart pattern that indicates a reversal post sensing weak selling interest on testing of the previous lows around 0.6760. However, the absence of follow-up buying conveys the rebound move as mere a pullback, which can be capitalized by investors for building fresh shorts.
The asset is struggling to shift auction above the 20-period Exponential Moving Average (EMA) at 0.6780, which indicates a lack of strength in the US Dollar. Also, the 50-EMA below 0.6800 is declining, which adds to the downside filters.
Meanwhile, the Relative Strength Index (RSI) (14) is oscillating in a 40.00-60.00 range, which indicates consolidation head.
For an upside move, USD/CNH needs to surpass the 50-EMA at around 6.8000, which will drive the asset toward January 9 high at 6.8292, followed by January 6 high at 6.8926.
On the contrary, a south-side move below Tuesday’s low at 6.7586 will drag the asset toward July 29 low at 6.7282 and round-level support at 6.7000.
Technical Levels: Supports and Resistances
USDCNH currently trading at 6.7866 at the time of writing. Pair opened at 6.7858 and is trading with a change of 0.01 % .
| Overview | Overview.1 | |
|---|---|---|
| 0 | Today last price | 6.7866 |
| 1 | Today Daily Change | 0.0008 |
| 2 | Today Daily Change % | 0.0100 |
| 3 | Today daily open | 6.7858 |
The pair remains strongly bearish on the daily time frame. It trades below the 20 SMA @ 6.9391, 50 SMA 7.0446, 100 SMA @ 7.0668 and 200 SMA @ 6.8749.
| Trends | Trends.1 | |
|---|---|---|
| 0 | Daily SMA20 | 6.9391 |
| 1 | Daily SMA50 | 7.0446 |
| 2 | Daily SMA100 | 7.0668 |
| 3 | Daily SMA200 | 6.8749 |
The previous day high was 6.7992 while the previous day low was 6.7588. The daily 38.2% Fib levels comes at 6.7838, expected to provide support. Similarly, the daily 61.8% fib level is at 6.7743, expected to provide support.
Note the levels of interest below:
- Pivot support is noted at 6.7634, 6.7409, 6.723
- Pivot resistance is noted at 6.8038, 6.8217, 6.8442
| Levels | Levels.1 |
|---|---|
| Previous Daily High | 6.7992 |
| Previous Daily Low | 6.7588 |
| Previous Weekly High | 6.9396 |
| Previous Weekly Low | 6.8236 |
| Previous Monthly High | 7.0914 |
| Previous Monthly Low | 6.9050 |
| Daily Fibonacci 38.2% | 6.7838 |
| Daily Fibonacci 61.8% | 6.7743 |
| Daily Pivot Point S1 | 6.7634 |
| Daily Pivot Point S2 | 6.7409 |
| Daily Pivot Point S3 | 6.7230 |
| Daily Pivot Point R1 | 6.8038 |
| Daily Pivot Point R2 | 6.8217 |
| Daily Pivot Point R3 | 6.8442 |
[/s2If]
Join Our Telegram Group
")


