#USDCAD @ 1.34220 extends its losses after sliding below a five-month-old support trendline that surpasses 1.3500. (Pivot Orderbook analysis)
…
This is a premium post.
[s2If !current_user_can(access_s2member_level4)]Please register for PREMIUM VERSION HERE to read full post below containing analysis. In case of any error or you think you are not able to read the full post below, please email us at support#nehcap.com [lwa][/s2If] [s2If current_user_can(access_s2member_level4)]
- USD/CAD extends its losses after sliding below a five-month-old support trendline that surpasses 1.3500.
- USD/CAD Price Analysis: A breach below 1.3357 could pave the way for further downside; otherwise, a test of 1.3500 is on the cards
The pair currently trades last at 1.34220.
The previous day high was 1.3445 while the previous day low was 1.3376. The daily 38.2% Fib levels comes at 1.3419, expected to provide support. Similarly, the daily 61.8% fib level is at 1.3403, expected to provide support.
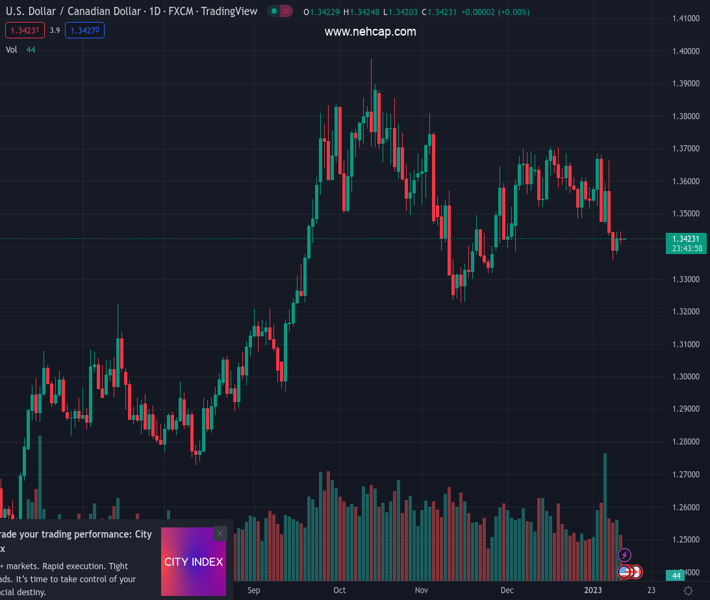
USD/CAD reverses its uptrend and drops below the 100-day Exponential Moving Average (EMA) at 1.3427, set to finish Wednesday’s session with losses of almost 0.01%. At the time of writing, the USD/CAD is trading at 1.3423 after hitting a daily high of 1.3445.
From a daily chart perspective, the USD/CAD is still neutral-biased, though slightly skewed to the downside. Once USD/CAD’s price action broke below a five-month-old upslope support trendline drawn from August 2022 lows on January 6, the USD/CAD resumed its downtrend, which stalled around the current week’s low of 1.3357.
To extend its downtrend, the USD/CAD needs to break below 1.3357 to extend its losses to the November 24 daily low of 1.3316, ahead of the 1.3300 mark. Once hurdled, the USD/CAD would be poised to test the 200-day EMA at 1.3238.
The USD/CAD downward bias in the near term is supported by the Relative Strength Index (RSI) in bearish territory, while the Rate of Change (RoC) portrays steady downward volatility, meaning that sellers remain in charge.
Technical Levels: Supports and Resistances
USDCAD currently trading at 1.3425 at the time of writing. Pair opened at 1.3426 and is trading with a change of -0.01 % .
| Overview | Overview.1 | |
|---|---|---|
| 0 | Today last price | 1.3425 |
| 1 | Today Daily Change | -0.0001 |
| 2 | Today Daily Change % | -0.0100 |
| 3 | Today daily open | 1.3426 |
The pair is trading below its 20 Daily moving average @ 1.357, below its 50 Daily moving average @ 1.3513 , below its 100 Daily moving average @ 1.3484 and above its 200 Daily moving average @ 1.3157
| Trends | Trends.1 | |
|---|---|---|
| 0 | Daily SMA20 | 1.3570 |
| 1 | Daily SMA50 | 1.3513 |
| 2 | Daily SMA100 | 1.3484 |
| 3 | Daily SMA200 | 1.3157 |
The previous day high was 1.3445 while the previous day low was 1.3376. The daily 38.2% Fib levels comes at 1.3419, expected to provide support. Similarly, the daily 61.8% fib level is at 1.3403, expected to provide support.
Note the levels of interest below:
- Pivot support is noted at 1.3386, 1.3347, 1.3317
- Pivot resistance is noted at 1.3455, 1.3485, 1.3524
| Levels | Levels.1 |
|---|---|
| Previous Daily High | 1.3445 |
| Previous Daily Low | 1.3376 |
| Previous Weekly High | 1.3685 |
| Previous Weekly Low | 1.3433 |
| Previous Monthly High | 1.3705 |
| Previous Monthly Low | 1.3385 |
| Daily Fibonacci 38.2% | 1.3419 |
| Daily Fibonacci 61.8% | 1.3403 |
| Daily Pivot Point S1 | 1.3386 |
| Daily Pivot Point S2 | 1.3347 |
| Daily Pivot Point S3 | 1.3317 |
| Daily Pivot Point R1 | 1.3455 |
| Daily Pivot Point R2 | 1.3485 |
| Daily Pivot Point R3 | 1.3524 |
[/s2If]
Join Our Telegram Group
")


