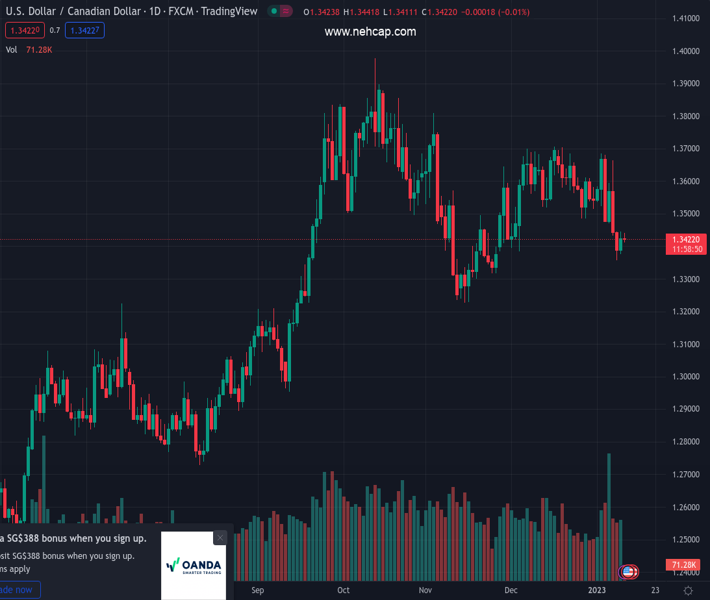
#USDCAD @ 1.34209 struggles to capitalize on the overnight bounce and edges lower on Wednesday. (Pivot Orderbook analysis)
…
This is a premium post.
[s2If !current_user_can(access_s2member_level4)]Please register for PREMIUM VERSION HERE to read full post below containing analysis. In case of any error or you think you are not able to read the full post below, please email us at support#nehcap.com [lwa][/s2If] [s2If current_user_can(access_s2member_level4)]
- USD/CAD struggles to capitalize on the overnight bounce and edges lower on Wednesday.
- An uptick in crude oil prices underpins the Loonie and caps the upside amid a softer USD.
- Traders seem reluctant and prefer to wait for the release of the US CPI report on Thursday.
The pair currently trades last at 1.34209.
The previous day high was 1.3445 while the previous day low was 1.3376. The daily 38.2% Fib levels comes at 1.3419, expected to provide support. Similarly, the daily 61.8% fib level is at 1.3403, expected to provide support.
The USD/CAD pair attracts some sellers in the vicinity of mid-1.3400s on Wednesday and erodes a part of the previous day’s recovery gains. Spot prices remain on the defensive through the first half of the European session, though manage to hold above the 1.3400 round-figure mark.
A modest uptick in crude oil prices underpins the commodity-linked Loonie and is seen as a key factor acting as a headwind for the USD/CAD pair. China’s biggest pivot away from its strict zero-COVID policy raises hopes for a sharp recovery in fuel demand and acts as a tailwind for the black liquid. That said, worries about a deeper global economic downturn might keep a lid on any meaningful gains for oil prices.
The US Dollar, on the other hand, is weighed down by a fresh leg down in the US Treasury bond yields amid growing acceptance that the Fed will soften its policy stance. Data released from the US last week indicated that the effect of the Fed’s large rate hikes in 2022 is being felt in the economy. This, in turn, lifts bets for smaller Fed rate hikes going forward and keeps the US bond yields depressed near a multi-week low.
Apart from this, a generally positive tone around the equity markets is seen denting the greenback’s relative safe-haven status. Traders, however, seem reluctant to place aggressive bets around the USD/CAD pair and prefer to wait on the sidelines ahead of the US consumer inflation figures, due for release on Thursday. In the meantime, the US bond yields, along with the US bond yields, could drive the USD demand
Apart from this, oil price dynamics will provide some impetus to the USD/CAD pair and assist traders to grab short-term opportunities. The fundamental backdrop, meanwhile, seems tilted firmly in favour of bearish traders, suggesting that any meaningful positive move is more likely to get sold into and remain capped, at least for now.
Technical Levels: Supports and Resistances
USDCAD currently trading at 1.3419 at the time of writing. Pair opened at 1.3426 and is trading with a change of -0.05 % .
| Overview | Overview.1 | |
|---|---|---|
| 0 | Today last price | 1.3419 |
| 1 | Today Daily Change | -0.0007 |
| 2 | Today Daily Change % | -0.0500 |
| 3 | Today daily open | 1.3426 |
The pair is trading below its 20 Daily moving average @ 1.357, below its 50 Daily moving average @ 1.3513 , below its 100 Daily moving average @ 1.3484 and above its 200 Daily moving average @ 1.3157
| Trends | Trends.1 | |
|---|---|---|
| 0 | Daily SMA20 | 1.3570 |
| 1 | Daily SMA50 | 1.3513 |
| 2 | Daily SMA100 | 1.3484 |
| 3 | Daily SMA200 | 1.3157 |
The previous day high was 1.3445 while the previous day low was 1.3376. The daily 38.2% Fib levels comes at 1.3419, expected to provide support. Similarly, the daily 61.8% fib level is at 1.3403, expected to provide support.
Note the levels of interest below:
- Pivot support is noted at 1.3386, 1.3347, 1.3317
- Pivot resistance is noted at 1.3455, 1.3485, 1.3524
| Levels | Levels.1 |
|---|---|
| Previous Daily High | 1.3445 |
| Previous Daily Low | 1.3376 |
| Previous Weekly High | 1.3685 |
| Previous Weekly Low | 1.3433 |
| Previous Monthly High | 1.3705 |
| Previous Monthly Low | 1.3385 |
| Daily Fibonacci 38.2% | 1.3419 |
| Daily Fibonacci 61.8% | 1.3403 |
| Daily Pivot Point S1 | 1.3386 |
| Daily Pivot Point S2 | 1.3347 |
| Daily Pivot Point S3 | 1.3317 |
| Daily Pivot Point R1 | 1.3455 |
| Daily Pivot Point R2 | 1.3485 |
| Daily Pivot Point R3 | 1.3524 |
[/s2If]
Join Our Telegram Group
")


