US Dollar Index fades the previous day’s corrective bounce off seven-month low. (Pivot Orderbook analysis)
…
This is a premium post.
[s2If !current_user_can(access_s2member_level4)]Please register for PREMIUM VERSION HERE to read full post below containing analysis. In case of any error or you think you are not able to read the full post below, please email us at support#nehcap.com [lwa][/s2If] [s2If current_user_can(access_s2member_level4)]
- US Dollar Index fades the previous day’s corrective bounce off seven-month low.
- US Treasury bond yields retreat after snapping two-day downtrend on Tuesday.
- Fed Chair Powell’s mum on future policy moves, mixed US data join anxiety ahead of CPI to probe DXY traders.
The pair currently trades last at 103.26.
The previous day high was 103.5 while the previous day low was 103.02. The daily 38.2% Fib levels comes at 103.31, expected to provide resistance. Similarly, the daily 61.8% fib level is at 103.2, expected to provide support.
US Dollar Index (DXY) remains pressured towards the 103.00 round figure, around 103.25 by the press time, as it fails to extend the previous day’s bounce off the multi-day low. In doing so, the greenback’s gauge versus the six major currencies traces the downbeat US Treasury yields while also portraying the market’s inaction ahead of the US Consumer Price Index (CPI) data.
That said, the US 10-year Treasury bond yields rose 10 basis points (bps) to 3.61% at the latest, following a corrective bounce to snap the two-day downtrend marked the previous day. The same join the upbeat Wall Street closing to help S&P 500 Futures print mild gains and weigh on the US Dollar’s safe-haven demand.
It’s worth noting that Federal Reserve (Fed) Chair Jerome Powell’s inability to provide and clear directions for the US central bank’s next moves at Riksbank’s International Symposium on Central Bank Independence amplified the market’s uncertainty and weighed on the US Dollar. The policymaker highlighted the Fed’s autonomous nature and no obligation towards climate control while praising the US central bank’s latest moves in his latest public appearances. It’s worth noting that Federal Reserve Governor Michelle Bowman failed to impress DXY bulls despite appearing hawkish while stating that more rate rises are needed to combat high inflation.
Elsewhere, mixed US data also probes the US Dollar Index bulls as the US NFIB Business Optimism Index for December dropped to the lowest levels since 2013 if ignoring multiple jitters during the global Covid wave. Further, US Wholesale Inventories also remained unchanged with 1.0% growth for November.
Alternatively, recession woes and the Fed policymakers’ hesitance in welcoming bearish bias keep the DXY bulls hopeful ahead of the key inflation data. On Tuesday, the World Bank (WB) came out with its revised economic forecasts and signaled a favor to the traditional haven. That said, the WB stated that it expects the global economy to grow by 1.7% in 2023, down sharply from 3% in June’s forecast, as reported by Reuters. The Washington-based institute also raised fears of global recession by citing the scale of recent slowdowns.
Looking forward, China’s headlines CPI and Producer Price Index (PPI) data for December may offer immediate directions but major attention will be given to the US inflation numbers for clarity.
Unless providing sustained trading beyond a downward-sloping support-turned-resistance line from mid-December 2022, around 103.40 by the press time, US Dollar Index remains vulnerable to further downside.
Technical Levels: Supports and Resistances
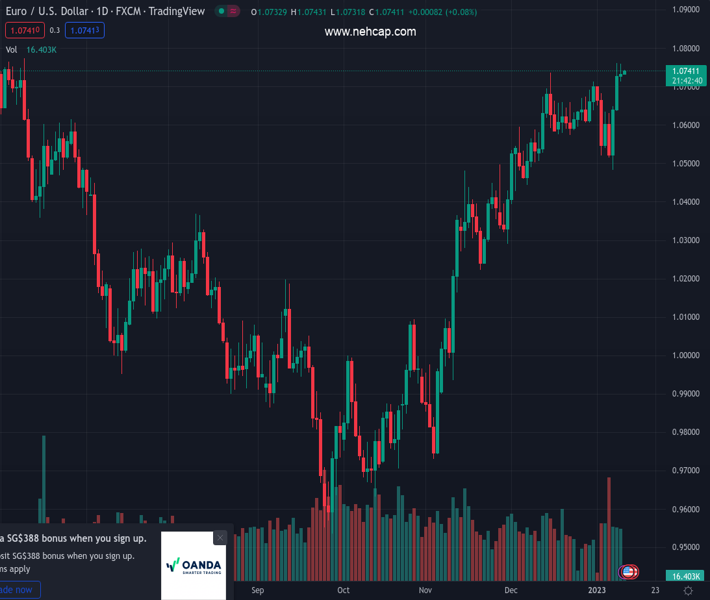
EURUSD currently trading at 103.26 at the time of writing. Pair opened at 103.3 and is trading with a change of -0.04% % .
| Overview | Overview.1 | |
|---|---|---|
| 0 | Today last price | 103.26 |
| 1 | Today Daily Change | -0.04 |
| 2 | Today Daily Change % | -0.04% |
| 3 | Today daily open | 103.3 |
The pair remains strongly bearish on the daily time frame. It trades below the 20 SMA @ 104.16, 50 SMA 105.17, 100 SMA @ 108.17 and 200 SMA @ 106.81.
| Trends | Trends.1 | |
|---|---|---|
| 0 | Daily SMA20 | 104.16 |
| 1 | Daily SMA50 | 105.17 |
| 2 | Daily SMA100 | 108.17 |
| 3 | Daily SMA200 | 106.81 |
The previous day high was 103.5 while the previous day low was 103.02. The daily 38.2% Fib levels comes at 103.31, expected to provide resistance. Similarly, the daily 61.8% fib level is at 103.2, expected to provide support.
Note the levels of interest below:
- Pivot support is noted at 103.05, 102.8, 102.57
- Pivot resistance is noted at 103.52, 103.75, 104.0
| Levels | Levels.1 |
|---|---|
| Previous Daily High | 103.50 |
| Previous Daily Low | 103.02 |
| Previous Weekly High | 105.63 |
| Previous Weekly Low | 103.43 |
| Previous Monthly High | 106.02 |
| Previous Monthly Low | 103.39 |
| Daily Fibonacci 38.2% | 103.31 |
| Daily Fibonacci 61.8% | 103.20 |
| Daily Pivot Point S1 | 103.05 |
| Daily Pivot Point S2 | 102.80 |
| Daily Pivot Point S3 | 102.57 |
| Daily Pivot Point R1 | 103.52 |
| Daily Pivot Point R2 | 103.75 |
| Daily Pivot Point R3 | 104.00 |
[/s2If]
Join Our Telegram Group
")


