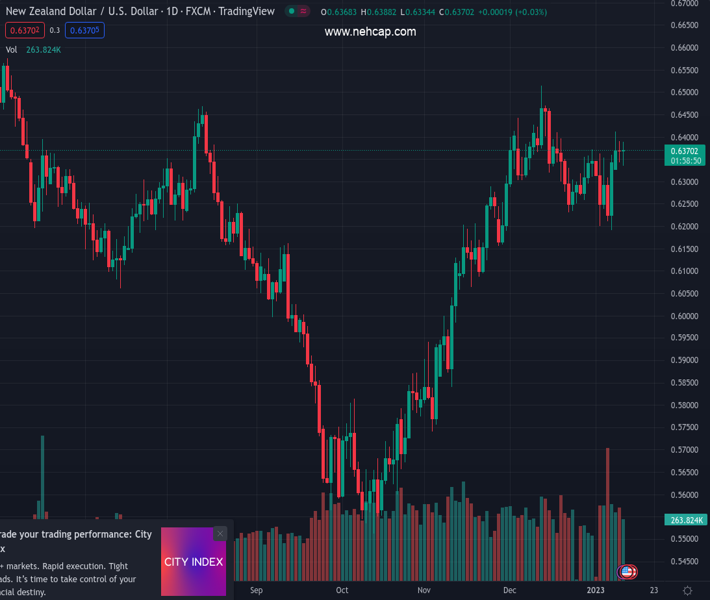
#NZDUSD @ 0.63704 The New Zealand Dollar failed to gain traction despite a risk-on impulse. (Pivot Orderbook analysis)
…
This is a premium post.
[s2If !current_user_can(access_s2member_level4)]Please register for PREMIUM VERSION HERE to read full post below containing analysis. In case of any error or you think you are not able to read the full post below, please email us at support#nehcap.com [lwa][/s2If] [s2If current_user_can(access_s2member_level4)]
- The New Zealand Dollar failed to gain traction despite a risk-on impulse.
- US Dollar remains soft amidst growing speculations for a soft US CPI print.
- China’s reopening could bolster the NZD outlook in the near term.
The pair currently trades last at 0.63704.
The previous day high was 0.6391 while the previous day low was 0.6342. The daily 38.2% Fib levels comes at 0.6361, expected to provide support. Similarly, the daily 61.8% fib level is at 0.6372, expected to provide resistance.
The NZD/USD prints successive series of doji’s, suggesting that neither buyers nor sellers are in charge, ahead of Thursday’s US Consumer Price Index (CPI) release. Hence, the NZD/USD is trading at 0.6374 above its opening price after hitting a daily high of 0.6388.
Wall Street is set to finish the session with solid gains between 0.56% and 1.24%. The NZD/USD remains in choppy trading as investors brace for the release of crucial US economic data. The consensus estimates that headline inflation in the US, known as the Consumer Price Index (CPI), would drop to 0% MoM, while year-over-year data is expected to decelerate from 7.1% to 6.5%. Excluding volatile items inflation, the so-called core CPI is forecasted to rise 0.3% MoM, while the consensus for annual-based core inflation is 5.7%.
Even though the World Bank’s tweaked its global growth forecasts to the downside, the New Zealand Dollar (NZD) remains linked to China’s economy. China’s reopening could trigger another leg-up in commodities. However, according to ANZ Bank, “tighter global monetary policy in the second half of the year” could help curb commodity inflation.
In the meantime, the US Dollar Index, a gauge of the buck’s value vs. its peers, continues to weaken, down by 0.05%, though it remains hovering around the 103.200 area.
Therefore, the NZD/USD might continue to trade sideways as traders get ready for US economic data releases. However, the New Zealand (NZ) docket will unveil Building Permits for December.
Technical Levels: Supports and Resistances
NZDUSD currently trading at 0.637 at the time of writing. Pair opened at 0.6371 and is trading with a change of -0.02 % .
| Overview | Overview.1 | |
|---|---|---|
| 0 | Today last price | 0.6370 |
| 1 | Today Daily Change | -0.0001 |
| 2 | Today Daily Change % | -0.0200 |
| 3 | Today daily open | 0.6371 |
The pair remains strongly bullish on the daily timeframe. It trades above its 20 SMA @ 0.6324, 50 SMA 0.6235, 100 SMA @ 0.6043 and 200 SMA @ 0.6219.
| Trends | Trends.1 | |
|---|---|---|
| 0 | Daily SMA20 | 0.6324 |
| 1 | Daily SMA50 | 0.6235 |
| 2 | Daily SMA100 | 0.6043 |
| 3 | Daily SMA200 | 0.6219 |
The previous day high was 0.6391 while the previous day low was 0.6342. The daily 38.2% Fib levels comes at 0.6361, expected to provide support. Similarly, the daily 61.8% fib level is at 0.6372, expected to provide resistance.
Note the levels of interest below:
- Pivot support is noted at 0.6345, 0.6319, 0.6296
- Pivot resistance is noted at 0.6394, 0.6417, 0.6443
| Levels | Levels.1 |
|---|---|
| Previous Daily High | 0.6391 |
| Previous Daily Low | 0.6342 |
| Previous Weekly High | 0.6363 |
| Previous Weekly Low | 0.6190 |
| Previous Monthly High | 0.6514 |
| Previous Monthly Low | 0.6230 |
| Daily Fibonacci 38.2% | 0.6361 |
| Daily Fibonacci 61.8% | 0.6372 |
| Daily Pivot Point S1 | 0.6345 |
| Daily Pivot Point S2 | 0.6319 |
| Daily Pivot Point S3 | 0.6296 |
| Daily Pivot Point R1 | 0.6394 |
| Daily Pivot Point R2 | 0.6417 |
| Daily Pivot Point R3 | 0.6443 |
[/s2If]
Join Our Telegram Group
")


