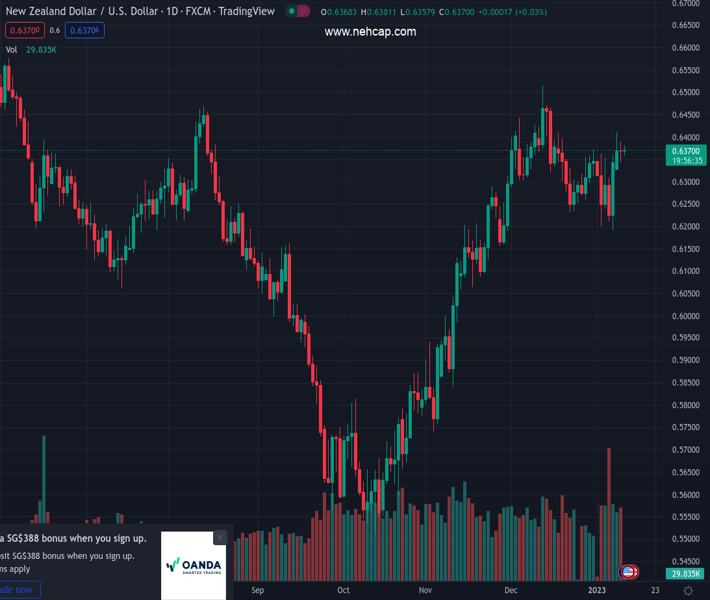
#NZDUSD @ 0.63673 seesaws inside a choppy trading range for the second consecutive day. (Pivot Orderbook analysis)
…
This is a premium post.
[s2If !current_user_can(access_s2member_level4)]Please register for PREMIUM VERSION HERE to read full post below containing analysis. In case of any error or you think you are not able to read the full post below, please email us at support#nehcap.com [lwa][/s2If] [s2If current_user_can(access_s2member_level4)]
- NZD/USD seesaws inside a choppy trading range for the second consecutive day.
- Sluggish markets restrict Kiwi pair’s immediate moves despite upbeat second-tier data from New Zealand.
- US Inflation is the key to clear directions, risk catalysts may entertain intraday traders.
The pair currently trades last at 0.63673.
The previous day high was 0.6391 while the previous day low was 0.6342. The daily 38.2% Fib levels comes at 0.6361, expected to provide support. Similarly, the daily 61.8% fib level is at 0.6372, expected to provide resistance.
NZD/USD struggles to justify the previous day’s bearish Doji candlestick as it treads water around 0.6370 during early Wednesday. In doing so, the Kiwi pair portrays the market’s inactivity amid a light calendar and mixed catalysts.
Among them, the US Dollar’s hesitance to track the downbeat US Treasury bond yields joins firmer New Zealand (NZ) data and a light calendar elsewhere. Also likely to restrict immediate NZD/USD moves could be the market’s cautious mood ahead of Thursday’s key inflation data for the US and China.
That said, New Zealand’s ANZ Commodity Price Index improved sharply to -0.1% in December versus -5.7% market forecasts and -4.0% prior.
Elsewhere, the US Dollar Index (DXY) remains pressured towards the 103.00 round figure, around 103.30 by the press time, as it struggles to extend Tuesday’s bounce off the seven-month low. In doing so, the greenback traces the downbeat US Treasury yields while also portraying the market’s inaction ahead of the US Consumer Price Index (CPI) data.
It’s worth mentioning that the US 10-year Treasury bond yields rose 10 basis points (bps) to 3.61% the previous day, following a corrective bounce to snap the two-day downtrend. However, the benchmark bond coupons retreated to 3.60% by the press time. The same join the upbeat Wall Street closing to help S&P 500 Futures print mild gains and weigh on the US Dollar’s safe-haven demand.
On a different page, the World Bank’s grim economic outlook and indecision over China’s prospects, following the latest reopening, also seem to trouble the NZD/USD pair amid an absence of any major data at home.
Moving on, NZD/USD may witness further lackluster moves amid anxiety ahead of Thursday’s inflation numbers from China and the US.
A weekly symmetrical triangle restricts short-term NZD/USD moves between 0.6385 and 0.6345. However, the bearish Doji candlestick, marked the previous day, keeps the sellers hopeful.
Technical Levels: Supports and Resistances
NZDUSD currently trading at 0.6371 at the time of writing. Pair opened at 0.6371 and is trading with a change of 0.00% % .
| Overview | Overview.1 | |
|---|---|---|
| 0 | Today last price | 0.6371 |
| 1 | Today Daily Change | 0.0000 |
| 2 | Today Daily Change % | 0.00% |
| 3 | Today daily open | 0.6371 |
The pair remains strongly bullish on the daily timeframe. It trades above its 20 SMA @ 0.6324, 50 SMA 0.6235, 100 SMA @ 0.6043 and 200 SMA @ 0.6219.
| Trends | Trends.1 | |
|---|---|---|
| 0 | Daily SMA20 | 0.6324 |
| 1 | Daily SMA50 | 0.6235 |
| 2 | Daily SMA100 | 0.6043 |
| 3 | Daily SMA200 | 0.6219 |
The previous day high was 0.6391 while the previous day low was 0.6342. The daily 38.2% Fib levels comes at 0.6361, expected to provide support. Similarly, the daily 61.8% fib level is at 0.6372, expected to provide resistance.
Note the levels of interest below:
- Pivot support is noted at 0.6345, 0.6319, 0.6296
- Pivot resistance is noted at 0.6394, 0.6417, 0.6443
| Levels | Levels.1 |
|---|---|
| Previous Daily High | 0.6391 |
| Previous Daily Low | 0.6342 |
| Previous Weekly High | 0.6363 |
| Previous Weekly Low | 0.6190 |
| Previous Monthly High | 0.6514 |
| Previous Monthly Low | 0.6230 |
| Daily Fibonacci 38.2% | 0.6361 |
| Daily Fibonacci 61.8% | 0.6372 |
| Daily Pivot Point S1 | 0.6345 |
| Daily Pivot Point S2 | 0.6319 |
| Daily Pivot Point S3 | 0.6296 |
| Daily Pivot Point R1 | 0.6394 |
| Daily Pivot Point R2 | 0.6417 |
| Daily Pivot Point R3 | 0.6443 |
[/s2If]
Join Our Telegram Group
")


