#GBPUSD @ 1.21589 remains sidelined after snapping two-day uptrend the previous day, picks up bids of late. (Pivot Orderbook analysis)
…
This is a premium post.
[s2If !current_user_can(access_s2member_level4)]Please register for PREMIUM VERSION HERE to read full post below containing analysis. In case of any error or you think you are not able to read the full post below, please email us at support#nehcap.com [lwa][/s2If] [s2If current_user_can(access_s2member_level4)]
- GBP/USD remains sidelined after snapping two-day uptrend the previous day, picks up bids of late.
- Cautious optimism allows Cable buyers to retake control ahead of the US CPI.
- UK, Japan brace for defense agreement, British PM praises healthcare conditions despite workers’ strikes.
- Risk catalysts could entertain traders ahead of inflation data.
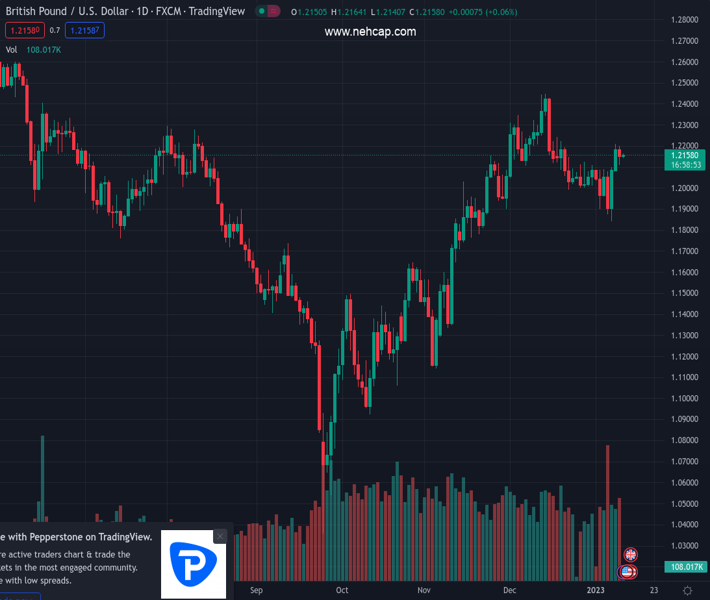
The pair currently trades last at 1.21589.
The previous day high was 1.2199 while the previous day low was 1.211. The daily 38.2% Fib levels comes at 1.2144, expected to provide support. Similarly, the daily 61.8% fib level is at 1.2165, expected to provide resistance.
GBP/USD treads water around 1.2150 heading into Wednesday’s London open as global markets remain mostly quiet ahead of the US inflation data, up for publishing on Thursday. Also acting as trading barriers are the mixed clues from the macro front, as well as an absence of major data/events ahead of the US Consumer Price Index (CPI) data for December.
That said, the market’s cautious optimism, mainly due to the central bankers’ hesitance in providing any monetary policy clues during the Riksbank event also seems to help the GBP/USD buyers. On the same line could be hopes of more stimulus from China and UK Prime Minister (PM) Rishi Sunak’s optimism surrounding the British healthcare sector despite the present strikes of medical workers.
Elsewhere, fears that China and Russia might not like the defense agreement between the UK and Japan seem to probe the GBP/USD buyers. Additionally weighing on the Cable prices could be the downbeat economic forecasts from the World Bank (WB). On Tuesday, the World Bank (WB) conveyed a pessimistic outlook while expecting the global economy to grow by 1.7% in 2023, down sharply from 3% in June’s forecast. The Washington-based institute also raised fears of global recession by citing the scale of recent slowdowns.
Amid these plays, the US 10-year Treasury bond yields retreat to 3.58% after rising 10 basis points (bps) to 3.61% the previous day. On the same line, the upbeat Wall Street closing helps S&P 500 Futures to remain firmer around 3,945, even as the equity gauge fails to impress bulls.
Looking forward, GBP/USD may witness further hardships in luring the momentum traders amid a light calendar. Even so, headlines surrounding the UK’s employment and inflation conditions, as well as from China, may entertain the Cable traders.
Tuesday’s hanging man candlestick on the daily chart of GBP/USD raises doubts about the pair’s latest recovery moves.
Technical Levels: Supports and Resistances
GBPUSD currently trading at 1.2158 at the time of writing. Pair opened at 1.2152 and is trading with a change of 0.05% % .
| Overview | Overview.1 | |
|---|---|---|
| 0 | Today last price | 1.2158 |
| 1 | Today Daily Change | 0.0006 |
| 2 | Today Daily Change % | 0.05% |
| 3 | Today daily open | 1.2152 |
The pair remains strongly bullish on the daily timeframe. It trades above its 20 SMA @ 1.2096, 50 SMA 1.1984, 100 SMA @ 1.1676 and 200 SMA @ 1.201.
| Trends | Trends.1 | |
|---|---|---|
| 0 | Daily SMA20 | 1.2096 |
| 1 | Daily SMA50 | 1.1984 |
| 2 | Daily SMA100 | 1.1676 |
| 3 | Daily SMA200 | 1.2010 |
The previous day high was 1.2199 while the previous day low was 1.211. The daily 38.2% Fib levels comes at 1.2144, expected to provide support. Similarly, the daily 61.8% fib level is at 1.2165, expected to provide resistance.
Note the levels of interest below:
- Pivot support is noted at 1.2108, 1.2065, 1.202
- Pivot resistance is noted at 1.2197, 1.2242, 1.2285
| Levels | Levels.1 |
|---|---|
| Previous Daily High | 1.2199 |
| Previous Daily Low | 1.2110 |
| Previous Weekly High | 1.2102 |
| Previous Weekly Low | 1.1841 |
| Previous Monthly High | 1.2447 |
| Previous Monthly Low | 1.1992 |
| Daily Fibonacci 38.2% | 1.2144 |
| Daily Fibonacci 61.8% | 1.2165 |
| Daily Pivot Point S1 | 1.2108 |
| Daily Pivot Point S2 | 1.2065 |
| Daily Pivot Point S3 | 1.2020 |
| Daily Pivot Point R1 | 1.2197 |
| Daily Pivot Point R2 | 1.2242 |
| Daily Pivot Point R3 | 1.2285 |
[/s2If]
Join Our Telegram Group
")


