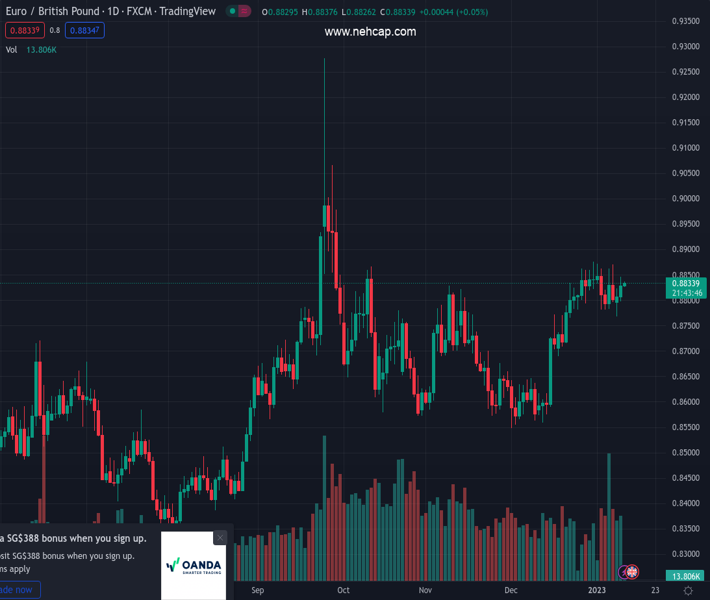
#EURGBP @ 0.88327 will deliver a Flag breakout after surpassing the 0.8870 resistance. (Pivot Orderbook analysis)
…
This is a premium post.
[s2If !current_user_can(access_s2member_level4)]Please register for PREMIUM VERSION HERE to read full post below containing analysis. In case of any error or you think you are not able to read the full post below, please email us at support#nehcap.com [lwa][/s2If] [s2If current_user_can(access_s2member_level4)]
- EUR/GBP will deliver a Flag breakout after surpassing the 0.8870 resistance.
- Advancing 200-EMA signals that the long-term trend is bullish.
- A 40.00-60.00 range oscillation by the RSI (14) conveys the unavailability of a potential trigger.
The pair currently trades last at 0.88327.
The previous day high was 0.8846 while the previous day low was 0.8799. The daily 38.2% Fib levels comes at 0.8828, expected to provide support. Similarly, the daily 61.8% fib level is at 0.8817, expected to provide support.
The EUR/GBP pair is displaying topsy-turvy moves below the crucial hurdle of 0.8840 in the Asian session. The cross trades directionless amid an absence of a potential trigger. Meanwhile, the European Central Bank (ECB) is expected to cease its policy tightening approach as ECB governing council member Mario Centeno cited that Eurozone inflation may face stiff resistance in January and February but will start falling from March.
On a four-hour scale, EUR/GBP is forming a Bullish Flag chart pattern that indicates a sheer consolidation, which is followed by a breakout in the same. Usually, the consolidation phase of the chart pattern serves as an inventory adjustment in which those participants initiate longs, which prefer to enter an auction after the establishment of a bullish bias.
The 50-period Exponential Moving Average (EMA) near 0.8820 has turned sideways, which indicates a consolidation ahead. While the 200-EMA at 0.8755 is still advancing, this signals that the long-term trend is bullish.
Meanwhile, the Relative Strength Index (RSI) (14) is oscillating in a 40.00-60.00 range. It conveys the unavailability of a potential trigger for a conviction move.
A break above January 6 high at 0.8871 will drive the asset towards the round-level resistance at 0.8900, followed by the September 29 high at 0.8979.
On the flip side, a downside move below Monday’s low at 0.8769 will drag the asset toward December 21 low at 0.8716. A slippage of the latter will drag the asset toward December 19 low at 0.8691.
Technical Levels: Supports and Resistances
EURGBP currently trading at 0.8836 at the time of writing. Pair opened at 0.8835 and is trading with a change of 0.01 % .
| Overview | Overview.1 | |
|---|---|---|
| 0 | Today last price | 0.8836 |
| 1 | Today Daily Change | 0.0001 |
| 2 | Today Daily Change % | 0.0100 |
| 3 | Today daily open | 0.8835 |
The pair remains strongly bullish on the daily timeframe. It trades above its 20 SMA @ 0.879, 50 SMA 0.8715, 100 SMA @ 0.8707 and 200 SMA @ 0.8591.
| Trends | Trends.1 | |
|---|---|---|
| 0 | Daily SMA20 | 0.8790 |
| 1 | Daily SMA50 | 0.8715 |
| 2 | Daily SMA100 | 0.8707 |
| 3 | Daily SMA200 | 0.8591 |
The previous day high was 0.8846 while the previous day low was 0.8799. The daily 38.2% Fib levels comes at 0.8828, expected to provide support. Similarly, the daily 61.8% fib level is at 0.8817, expected to provide support.
Note the levels of interest below:
- Pivot support is noted at 0.8807, 0.878, 0.876
- Pivot resistance is noted at 0.8855, 0.8874, 0.8902
| Levels | Levels.1 |
|---|---|
| Previous Daily High | 0.8846 |
| Previous Daily Low | 0.8799 |
| Previous Weekly High | 0.8875 |
| Previous Weekly Low | 0.8783 |
| Previous Monthly High | 0.8877 |
| Previous Monthly Low | 0.8547 |
| Daily Fibonacci 38.2% | 0.8828 |
| Daily Fibonacci 61.8% | 0.8817 |
| Daily Pivot Point S1 | 0.8807 |
| Daily Pivot Point S2 | 0.8780 |
| Daily Pivot Point S3 | 0.8760 |
| Daily Pivot Point R1 | 0.8855 |
| Daily Pivot Point R2 | 0.8874 |
| Daily Pivot Point R3 | 0.8902 |
[/s2If]
Join Our Telegram Group
")


