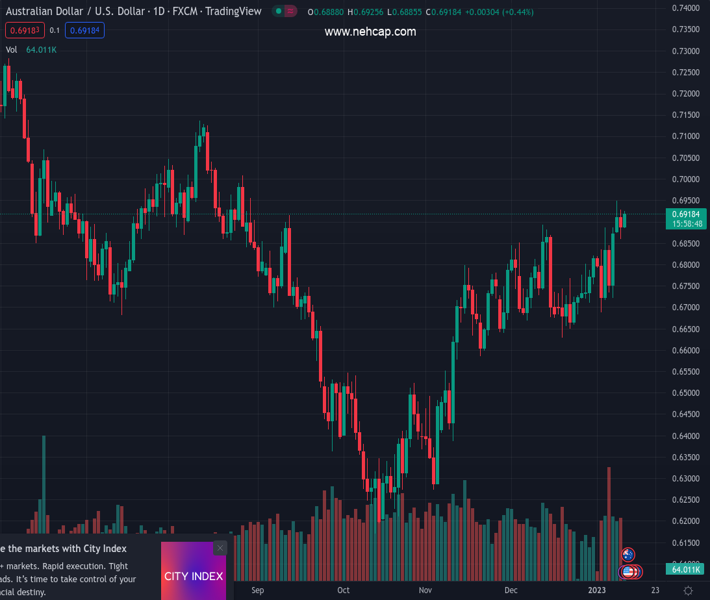
#AUDUSD @ 0.69173 Australian Dollar has picked strength as Chinese firms have resumed Australian coal imports. (Pivot Orderbook analysis)
…
This is a premium post.
[s2If !current_user_can(access_s2member_level4)]Please register for PREMIUM VERSION HERE to read full post below containing analysis. In case of any error or you think you are not able to read the full post below, please email us at support#nehcap.com [lwa][/s2If] [s2If current_user_can(access_s2member_level4)]
- Australian Dollar has picked strength as Chinese firms have resumed Australian coal imports.
- The USD Index has sensed sheer selling pressure after failing to surpass 103.00.
- Aussie has resumed its upside journey after sensing support around the demand zone plotted in a 0.6884-0.6896 range.
The pair currently trades last at 0.69173.
The previous day high was 0.6928 while the previous day low was 0.686. The daily 38.2% Fib levels comes at 0.6886, expected to provide support. Similarly, the daily 61.8% fib level is at 0.6902, expected to provide support.
The AUD/USD pair has overstepped its immediate resistance of 0.6917 in the early European session. The Aussie asset has picked strength amid selling pressure in the US Dollar Index (DXY) after the latter failed to surpass the immediate resistance of 103.00.
The market mood is still quiet as S&P500 futures are marginally higher. Out of the major FX currencies, the Australian Dollar is performing better. It seems that the resumption of Australian coal imports by Chinese companies is strengthening the Australian Dollar in comparison with other risk-perceived currencies.
On a four-hour scale, the Aussie asset has resumed its upside journey after sensing support around the demand zone plotted in a 0.6884-0.6896 range. The 20-period Exponential Moving Average (EMA) at 0.6884 is acting as major support for the Australian Dollar. Upward-sloping 50-EMA at 0.6840 indicates that the upside bias is still solid.
Meanwhile, the Relative Strength Index (RSI) is on the edge of recapturing the bullish range of 60.00-80.00, which will trigger the bullish momentum.
For further upside, the Aussie asset needs to surpass Tuesday’s high at 0.6937, which will send the major near the psychological resistance at 0.7000. After conquering 0.7000, Aussie bulls will march towards August 11 high at 0.7137.
On the contrary, a downside move below December 29 low at 0.6710 will drag the major further towards December 22 low at 0.6650 followed by November 21 low at 0.6585.
Technical Levels: Supports and Resistances
AUDUSD currently trading at 0.6924 at the time of writing. Pair opened at 0.6893 and is trading with a change of 0.45 % .
| Overview | Overview.1 | |
|---|---|---|
| 0 | Today last price | 0.6924 |
| 1 | Today Daily Change | 0.0031 |
| 2 | Today Daily Change % | 0.4500 |
| 3 | Today daily open | 0.6893 |
The pair remains strongly bullish on the daily timeframe. It trades above its 20 SMA @ 0.6765, 50 SMA 0.6704, 100 SMA @ 0.6635 and 200 SMA @ 0.6839.
| Trends | Trends.1 | |
|---|---|---|
| 0 | Daily SMA20 | 0.6765 |
| 1 | Daily SMA50 | 0.6704 |
| 2 | Daily SMA100 | 0.6635 |
| 3 | Daily SMA200 | 0.6839 |
The previous day high was 0.6928 while the previous day low was 0.686. The daily 38.2% Fib levels comes at 0.6886, expected to provide support. Similarly, the daily 61.8% fib level is at 0.6902, expected to provide support.
Note the levels of interest below:
- Pivot support is noted at 0.6859, 0.6826, 0.6791
- Pivot resistance is noted at 0.6928, 0.6962, 0.6996
| Levels | Levels.1 |
|---|---|
| Previous Daily High | 0.6928 |
| Previous Daily Low | 0.6860 |
| Previous Weekly High | 0.6887 |
| Previous Weekly Low | 0.6688 |
| Previous Monthly High | 0.6893 |
| Previous Monthly Low | 0.6629 |
| Daily Fibonacci 38.2% | 0.6886 |
| Daily Fibonacci 61.8% | 0.6902 |
| Daily Pivot Point S1 | 0.6859 |
| Daily Pivot Point S2 | 0.6826 |
| Daily Pivot Point S3 | 0.6791 |
| Daily Pivot Point R1 | 0.6928 |
| Daily Pivot Point R2 | 0.6962 |
| Daily Pivot Point R3 | 0.6996 |
[/s2If]
Join Our Telegram Group
")


