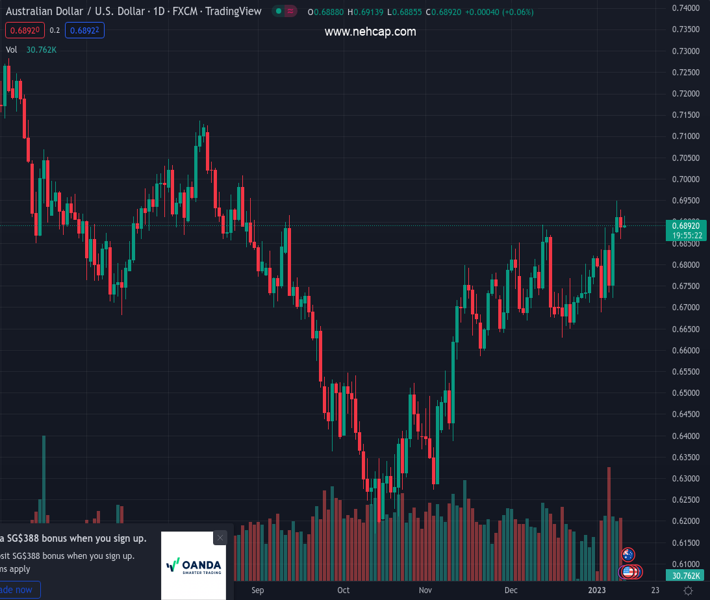
#AUDUSD @ 0.68886 is struggling to shift its auction profile above 0.6900 as US Dollar Index has rebounded. (Pivot Orderbook analysis)
…
This is a premium post.
[s2If !current_user_can(access_s2member_level4)]Please register for PREMIUM VERSION HERE to read full post below containing analysis. In case of any error or you think you are not able to read the full post below, please email us at support#nehcap.com [lwa][/s2If] [s2If current_user_can(access_s2member_level4)]
- AUD/USD is struggling to shift its auction profile above 0.6900 as US Dollar Index has rebounded.
- The Australian Dollar failed to pick strength despite higher-than-anticipated Australian inflation and Retail Sales data.
- An escalation in inflation print and retail demand might force the RBA to tighten policy further.
The pair currently trades last at 0.68886.
The previous day high was 0.6928 while the previous day low was 0.686. The daily 38.2% Fib levels comes at 0.6886, expected to provide support. Similarly, the daily 61.8% fib level is at 0.6902, expected to provide resistance.
The AUD/USD has failed to sustain above the immediate resistance of 0.6900 despite better-than-projected Australian inflation providing strength to the Australian Dollar. The Aussie asset has sensed heat as the US Dollar Index (DXY) has rebounded in its early trade. The USD Index has stretched to near the round-level resistance at 103.00
S&P500 futures have surrendered gains recorded in early Asia, portraying a decline in investors’ risk appetite. Also, 10-year US Treasury yields are facing immense pressure and have dropped below 3.60%.
In early Asia, the Australian Dollar displayed volatility after the release of the monthly Australian inflation and Retail Sales data. The Australian Bureau of Statistics reported monthly inflation at 7.4% that the consensus of 7.3% and the former release of 6.9%. Apart from that, monthly Retail Sales (Nov) have jumped to 1.4% against the projections of 0.6%.
This might result in unrest for Reserve Bank of Australia (RBA) policymakers as they are putting ‘blood and sweat’ into taming healthy inflation.
Meanwhile, market participants are continuously chattering over the reopening of China after stretched lockdown led by the Covid-19 epidemic. Economists at JP Morgan are of the view that China’s reopening from the Covid restrictions will likely boost Australian economic growth by around 1.0%. It is worth noting that Australia is a leading trading partner of China and economic prospects in China impact the Australian Dollar.
This week, the United States Consumer Price Index (CPI) will remain spotlight. As per the consensus, the headline CPI will drop to 6.5% from the former release of 7.1% while the core inflation that doesn’t inculcate food and energy prices may scale lower to 5.7% vs. the prior release of 6.0%.
Technical Levels: Supports and Resistances
AUDUSD currently trading at 0.6888 at the time of writing. Pair opened at 0.6893 and is trading with a change of -0.07 % .
| Overview | Overview.1 | |
|---|---|---|
| 0 | Today last price | 0.6888 |
| 1 | Today Daily Change | -0.0005 |
| 2 | Today Daily Change % | -0.0700 |
| 3 | Today daily open | 0.6893 |
The pair remains strongly bullish on the daily timeframe. It trades above its 20 SMA @ 0.6765, 50 SMA 0.6704, 100 SMA @ 0.6635 and 200 SMA @ 0.6839.
| Trends | Trends.1 | |
|---|---|---|
| 0 | Daily SMA20 | 0.6765 |
| 1 | Daily SMA50 | 0.6704 |
| 2 | Daily SMA100 | 0.6635 |
| 3 | Daily SMA200 | 0.6839 |
The previous day high was 0.6928 while the previous day low was 0.686. The daily 38.2% Fib levels comes at 0.6886, expected to provide support. Similarly, the daily 61.8% fib level is at 0.6902, expected to provide resistance.
Note the levels of interest below:
- Pivot support is noted at 0.6859, 0.6826, 0.6791
- Pivot resistance is noted at 0.6928, 0.6962, 0.6996
| Levels | Levels.1 |
|---|---|
| Previous Daily High | 0.6928 |
| Previous Daily Low | 0.6860 |
| Previous Weekly High | 0.6887 |
| Previous Weekly Low | 0.6688 |
| Previous Monthly High | 0.6893 |
| Previous Monthly Low | 0.6629 |
| Daily Fibonacci 38.2% | 0.6886 |
| Daily Fibonacci 61.8% | 0.6902 |
| Daily Pivot Point S1 | 0.6859 |
| Daily Pivot Point S2 | 0.6826 |
| Daily Pivot Point S3 | 0.6791 |
| Daily Pivot Point R1 | 0.6928 |
| Daily Pivot Point R2 | 0.6962 |
| Daily Pivot Point R3 | 0.6996 |
[/s2If]
Join Our Telegram Group
")


