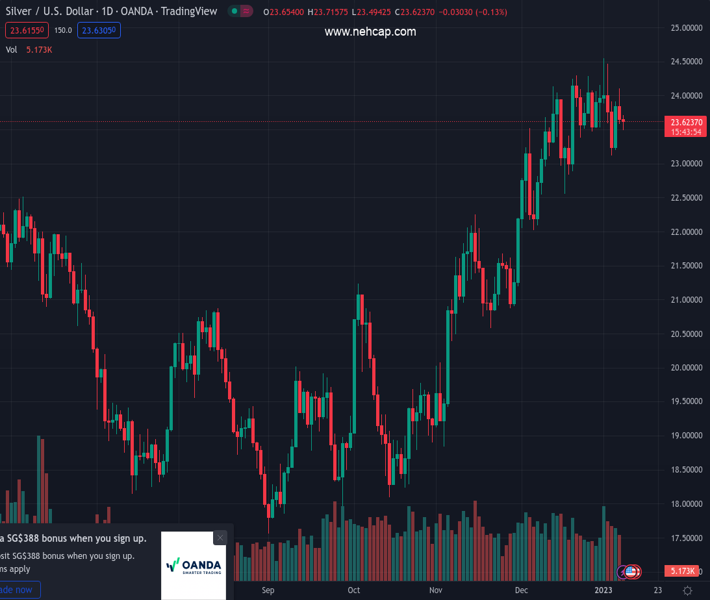
#XAGUSD @ 23.626 A decline in the US Dollar Index has shifted traction in favor of Silver price. (Pivot Orderbook analysis)
…
This is a premium post.
[s2If !current_user_can(access_s2member_level4)]Please register for PREMIUM VERSION HERE to read full post below containing analysis. In case of any error or you think you are not able to read the full post below, please email us at support#nehcap.com [lwa][/s2If] [s2If current_user_can(access_s2member_level4)]
- A decline in the US Dollar Index has shifted traction in favor of Silver price.
- Investors’ risk appetite has improved amid a rebound in S&P500 futures.
- The 200-period EMA is overlapping with the white metal prices, which indicates a lackluster performance ahead.
The pair currently trades last at 23.626.
The previous day high was 24.1 while the previous day low was 23.58. The daily 38.2% Fib levels comes at 23.78, expected to provide resistance. Similarly, the daily 61.8% fib level is at 23.91, expected to provide resistance.
Silver price (XAG/USD) has rebounded firmly after dropping to near $23.50 in the Asian session. The white metal has extended its recovery above the immediate resistance of $23.60 as the US Dollar Index (DXY) is facing heat amid failing to recapture the critical hurdle of 103.00.
It seems that the risk appetite of the market participants is improving again as S&P500 futures have trimmed the majority of their morning losses. Also, the 10-year US Treasury yields have dropped to 3.53%.
On an hourly scale, the Silver price has sensed buying interest after correcting to near the horizontal support plotted from December 29 low at $23.46. Broadly, the 200-period Exponential Moving Average (EMA) at $23.75 is overlapping with the white metal prices, which is indicating a lackluster performance ahead.
Meanwhile, the Relative Strength Index (RSI) (14) is aiming to shift into the 40.00-60.00 range from the bearish range of 20.00-40.00, which indicates an attempt for a bullish reversal.
For an upside move, the Silver price needs to break above Monday’s high at $24.10, which will drive the asset towards January 3 high at $24.55 followed by the psychological resistance at $25.00.
On the contrary, a declining move below January 5 low at $23.12 will drag the Silver price toward December 19 low and December 16 low at $22.84 and $22.56 respectively.
Technical Levels: Supports and Resistances
XAGUSD currently trading at 23.63 at the time of writing. Pair opened at 23.63 and is trading with a change of 0.0 % .
| Overview | Overview.1 | |
|---|---|---|
| 0 | Today last price | 23.63 |
| 1 | Today Daily Change | 0.00 |
| 2 | Today Daily Change % | 0.00 |
| 3 | Today daily open | 23.63 |
The pair is trading below its 20 Daily moving average @ 23.69, above its 50 Daily moving average @ 22.4 , above its 100 Daily moving average @ 20.76 and above its 200 Daily moving average @ 21.09
| Trends | Trends.1 | |
|---|---|---|
| 0 | Daily SMA20 | 23.69 |
| 1 | Daily SMA50 | 22.40 |
| 2 | Daily SMA100 | 20.76 |
| 3 | Daily SMA200 | 21.09 |
The previous day high was 24.1 while the previous day low was 23.58. The daily 38.2% Fib levels comes at 23.78, expected to provide resistance. Similarly, the daily 61.8% fib level is at 23.91, expected to provide resistance.
Note the levels of interest below:
- Pivot support is noted at 23.44, 23.25, 22.92
- Pivot resistance is noted at 23.96, 24.29, 24.48
| Levels | Levels.1 |
|---|---|
| Previous Daily High | 24.10 |
| Previous Daily Low | 23.58 |
| Previous Weekly High | 24.55 |
| Previous Weekly Low | 23.12 |
| Previous Monthly High | 24.30 |
| Previous Monthly Low | 22.03 |
| Daily Fibonacci 38.2% | 23.78 |
| Daily Fibonacci 61.8% | 23.91 |
| Daily Pivot Point S1 | 23.44 |
| Daily Pivot Point S2 | 23.25 |
| Daily Pivot Point S3 | 22.92 |
| Daily Pivot Point R1 | 23.96 |
| Daily Pivot Point R2 | 24.29 |
| Daily Pivot Point R3 | 24.48 |
[/s2If]
Join Our Telegram Group
")


