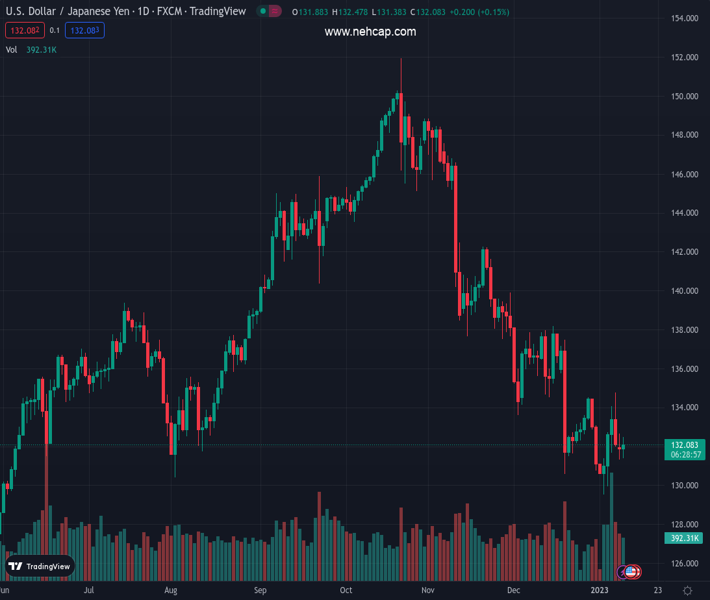
#USDJPY @ 132.098 The seesaws nearby the 132.00 figure though it remains unable to reclaim it. (Pivot Orderbook analysis)
…
This is a premium post.
[s2If !current_user_can(access_s2member_level4)]Please register for PREMIUM VERSION HERE to read full post below containing analysis. In case of any error or you think you are not able to read the full post below, please email us at support#nehcap.com [lwa][/s2If] [s2If current_user_can(access_s2member_level4)]
- The USD/JPY seesaws nearby the 132.00 figure though it remains unable to reclaim it.
- Traders’ mood improved as US equities turned green, while the US Dollar continued to edge lower.
- USD/JPY Price Analysis: To remain sideways around 132.00 ahead of Thursday’s US CPI report.
The pair currently trades last at 132.098.
The previous day high was 132.66 while the previous day low was 131.3. The daily 38.2% Fib levels comes at 131.82, expected to provide support. Similarly, the daily 61.8% fib level is at 132.14, expected to provide resistance.
The USD/JPY clings to gains following the release of the US Federal Reserve (Fed) Chair Jerome Powell’s Speech at Sweeden Riksbank, which did not acknowledge monetary policy, but rather focused on central bank independence. Therefore, risk appetite continues to improve as Wall Street futures shed some losses. At the time of writing, the USD/JPY is trading at 132.06, registering modest gains of 0.07%.
Investors’ mood was negative ahead of the Fed’s Chair Powell speech. According to newswires, equities pullback was attributed to Fed’s Bostic and Daly comments on Monday, seen as hawkish. Nevertheless, the financial market did not respond to a “reprice” of a less hawkish Fed, meaning that US Treasury bond yields continued to fall, ignoring Fed officials’ comments.
Data-wise, an absent US economic docket keeps the USD/JPY trading unchanged. However, comments by Fed policymakers emphasizing the central bank’s resolution to curb inflation slightly weighed on investors’ mood. Fed’s Daly and Bostic added that rates would need to be above the 5% range and would need to be held higher for longer, at least until 2024.
As mentioned above, the odds for a 25 bps rate hike by the Federal Reserve remain at 77.2%, while for 50 bps stand at 22.8%.
Earlier in the Asian session, a hot Tokyo CPI print on an annual basis, around 4%, failed to underpin the Japanese Yen (JPY). So, in the short term, further USD/JPY upside could be expected.
The US Dollar Index (DXY), which tracks the buck’s value against a basket of six currencies, including the Japanese Yen (JPY), drops 0.06%, at 103.244. in the meantime, the US 10-year Treasury bond yield, which positively correlates with the USD/JPY, is gaining almost four bps, up at 3.573%, underpinning the USD/JPY.
Therefore, the USD/JPY bias remains neutral-to-downwards, though, in the near term, it could remain sideways ahead of Thursday’s US inflation report. For the USD/JPY to shift bullish, it would need a daily close above the 20-day Exponential Moving Average (EMA) above 133.38, which could underpin the major to test the 200-day EMA at 134.74. Otherwise, a fall beneath January’s 9 daily low of 131.30 could open the door for a test of the YTD low of 129.50.
Technical Levels: Supports and Resistances
USDJPY currently trading at 132.01 at the time of writing. Pair opened at 131.8 and is trading with a change of 0.16 % .
| Overview | Overview.1 | |
|---|---|---|
| 0 | Today last price | 132.01 |
| 1 | Today Daily Change | 0.21 |
| 2 | Today Daily Change % | 0.16 |
| 3 | Today daily open | 131.80 |
The pair remains strongly bearish on the daily time frame. It trades below the 20 SMA @ 133.42, 50 SMA 137.68, 100 SMA @ 140.89 and 200 SMA @ 136.51.
| Trends | Trends.1 | |
|---|---|---|
| 0 | Daily SMA20 | 133.42 |
| 1 | Daily SMA50 | 137.68 |
| 2 | Daily SMA100 | 140.89 |
| 3 | Daily SMA200 | 136.51 |
The previous day high was 132.66 while the previous day low was 131.3. The daily 38.2% Fib levels comes at 131.82, expected to provide support. Similarly, the daily 61.8% fib level is at 132.14, expected to provide resistance.
Note the levels of interest below:
- Pivot support is noted at 131.18, 130.57, 129.83
- Pivot resistance is noted at 132.53, 133.27, 133.88
| Levels | Levels.1 |
|---|---|
| Previous Daily High | 132.66 |
| Previous Daily Low | 131.30 |
| Previous Weekly High | 134.78 |
| Previous Weekly Low | 129.51 |
| Previous Monthly High | 138.18 |
| Previous Monthly Low | 130.57 |
| Daily Fibonacci 38.2% | 131.82 |
| Daily Fibonacci 61.8% | 132.14 |
| Daily Pivot Point S1 | 131.18 |
| Daily Pivot Point S2 | 130.57 |
| Daily Pivot Point S3 | 129.83 |
| Daily Pivot Point R1 | 132.53 |
| Daily Pivot Point R2 | 133.27 |
| Daily Pivot Point R3 | 133.88 |
[/s2If]
Join Our Telegram Group
")


