#USDJPY @ 131.610 remains pressured for third consecutive day as sellers poke one-week-old support line., @nehcap view: Further downside expected (Pivot Orderbook analysis)
…
This is a premium post.
[s2If !current_user_can(access_s2member_level4)]Please register for PREMIUM VERSION HERE to read full post below containing analysis. In case of any error or you think you are not able to read the full post below, please email us at support#nehcap.com [lwa][/s2If] [s2If current_user_can(access_s2member_level4)]
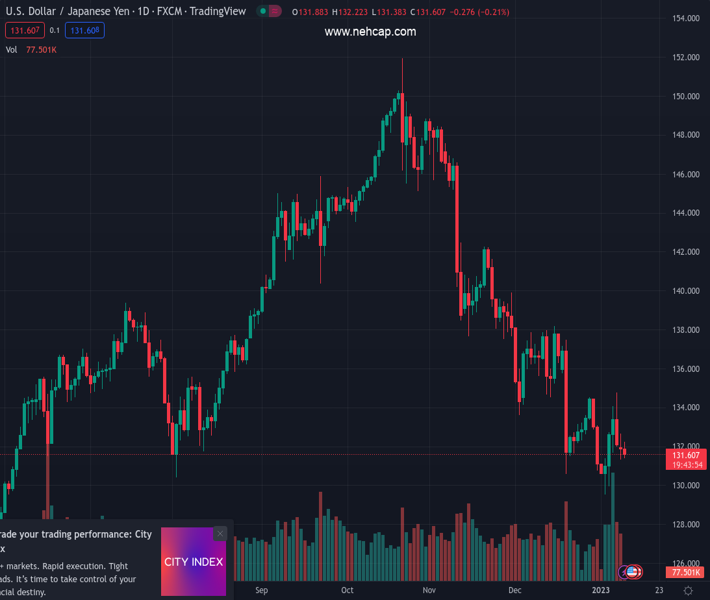
- USD/JPY remains pressured for third consecutive day as sellers poke one-week-old support line.
- Bearish MACD signals, downbeat RSI signal further south-run.
- Any recovery remains elusive below 135.00 resistance confluence.
The pair currently trades last at 131.610.
The previous day high was 132.66 while the previous day low was 131.3. The daily 38.2% Fib levels comes at 131.82, expected to provide resistance. Similarly, the daily 61.8% fib level is at 132.14, expected to provide resistance.
USD/JPY holds lower ground near the intraday bottom surrounding 131.30 as bears flirt with the short-term key support during early Tuesday. In doing so, the Yen pair prints a three-day downtrend while justifying the bearish MACD signals and the absence of an oversold RSI (14).
With this, the USD/JPY price is likely to remain weak and could break the one-week-old support line, near 131.30 by the press time, in the near term.
Following that, the 131.00 round figure and 130.00 psychological magnet may entertain the Yen pair sellers before directing them to the recent trough surrounding 129.50.
It’s worth noting that the RSI (14) could turn oversold when the USD/JPY hit 129.50, which in turn may trigger a corrective bounce, if not then the 61.8% Fibonacci Expansion (FE) of the pair’s moves between November 30, 2022, and January 03, 2023, close to 128.30, will be in focus.
On the contrary, recovery moves may initially aim for the previous day’s peak of 132.65 before heading towards the late December 2022 swing high surrounding 134.50.
However, the 200-SMA and a downward-sloping resistance line from November 30, 2022, close to 135.00 by the press time, will be a tough nut to crack for the USD/JPY bulls to retake control.
Trend: Further downside expected
Technical Levels: Supports and Resistances
USDJPY currently trading at 131.52 at the time of writing. Pair opened at 131.8 and is trading with a change of -0.21% % .
| Overview | Overview.1 | |
|---|---|---|
| 0 | Today last price | 131.52 |
| 1 | Today Daily Change | -0.28 |
| 2 | Today Daily Change % | -0.21% |
| 3 | Today daily open | 131.8 |
The pair remains strongly bearish on the daily time frame. It trades below the 20 SMA @ 133.42, 50 SMA 137.68, 100 SMA @ 140.89 and 200 SMA @ 136.51.
| Trends | Trends.1 | |
|---|---|---|
| 0 | Daily SMA20 | 133.42 |
| 1 | Daily SMA50 | 137.68 |
| 2 | Daily SMA100 | 140.89 |
| 3 | Daily SMA200 | 136.51 |
The previous day high was 132.66 while the previous day low was 131.3. The daily 38.2% Fib levels comes at 131.82, expected to provide resistance. Similarly, the daily 61.8% fib level is at 132.14, expected to provide resistance.
Note the levels of interest below:
- Pivot support is noted at 131.18, 130.57, 129.83
- Pivot resistance is noted at 132.53, 133.27, 133.88
| Levels | Levels.1 |
|---|---|
| Previous Daily High | 132.66 |
| Previous Daily Low | 131.30 |
| Previous Weekly High | 134.78 |
| Previous Weekly Low | 129.51 |
| Previous Monthly High | 138.18 |
| Previous Monthly Low | 130.57 |
| Daily Fibonacci 38.2% | 131.82 |
| Daily Fibonacci 61.8% | 132.14 |
| Daily Pivot Point S1 | 131.18 |
| Daily Pivot Point S2 | 130.57 |
| Daily Pivot Point S3 | 129.83 |
| Daily Pivot Point R1 | 132.53 |
| Daily Pivot Point R2 | 133.27 |
| Daily Pivot Point R3 | 133.88 |
[/s2If]
Join Our Telegram Group
")


