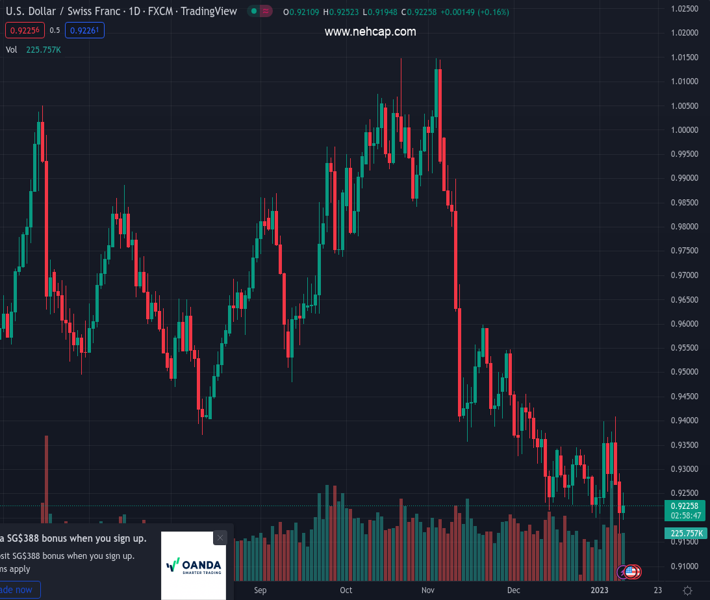
#USDCHF @ 0.92269 rebounds around 0.9170s as buyers stepped in, lifting the pair nearby 0.9200. (Pivot Orderbook analysis)
…
This is a premium post.
[s2If !current_user_can(access_s2member_level4)]Please register for PREMIUM VERSION HERE to read full post below containing analysis. In case of any error or you think you are not able to read the full post below, please email us at support#nehcap.com [lwa][/s2If] [s2If current_user_can(access_s2member_level4)]
- USD/CHF rebounds around 0.9170s as buyers stepped in, lifting the pair nearby 0.9200.
- For the USD/CHF to extend its losses, it needs a daily close below 0.9200.
- Otherwise, a bullish harami candlestick pattern could exacerbate a USD/CHF rally toward 0.9300.
The pair currently trades last at 0.92269.
The previous day high was 0.9283 while the previous day low was 0.9167. The daily 38.2% Fib levels comes at 0.9211, expected to provide support. Similarly, the daily 61.8% fib level is at 0.9239, expected to provide resistance.
USD/CHF is trimming Monday’s losses and bounces from daily lows, as sellers failed to gain traction beneath the 0.9200 figure, achieving a daily low of 0.9194 before giving way to buyers. Therefore, the USD/CHF is forming a bullish harami candlestick pattern, pending confirmation. Therefore, the USD/CHF is trading at 0.9234, gaining 0.25%.
After failing to extend its losses below 0.9167, the USD/CHF stages a comeback. Formation of a bullish harami could open the door for further upside, though it needs to be confirmed once the USD/CHF reclaims 0.9292. If that scenario is achieved, then the USD/CHF next resistance would be the 20-day Exponential Moving Average (EMA), which tracks bullish/bearishness price action in the pair, at 0.9299. followed by the last week’s high of 0.9409.
However, the Relative Strength Index (RSI) remains at bearish territory, though aiming up, keeping buyer hopeful of higher prices.
As an alternate scenario, the USD/CHF key support levels would be the 0.9200 figure, followed by the January 9 daily low of 0.9167, ahead of the 0.9100 mark.
Technical Levels: Supports and Resistances
USDCHF currently trading at 0.9231 at the time of writing. Pair opened at 0.9212 and is trading with a change of 0.21 % .
| Overview | Overview.1 | |
|---|---|---|
| 0 | Today last price | 0.9231 |
| 1 | Today Daily Change | 0.0019 |
| 2 | Today Daily Change % | 0.2100 |
| 3 | Today daily open | 0.9212 |
The pair remains strongly bearish on the daily time frame. It trades below the 20 SMA @ 0.929, 50 SMA 0.9458, 100 SMA @ 0.9639 and 200 SMA @ 0.9645.
| Trends | Trends.1 | |
|---|---|---|
| 0 | Daily SMA20 | 0.9290 |
| 1 | Daily SMA50 | 0.9458 |
| 2 | Daily SMA100 | 0.9639 |
| 3 | Daily SMA200 | 0.9645 |
The previous day high was 0.9283 while the previous day low was 0.9167. The daily 38.2% Fib levels comes at 0.9211, expected to provide support. Similarly, the daily 61.8% fib level is at 0.9239, expected to provide resistance.
Note the levels of interest below:
- Pivot support is noted at 0.9158, 0.9105, 0.9042
- Pivot resistance is noted at 0.9274, 0.9337, 0.939
| Levels | Levels.1 |
|---|---|
| Previous Daily High | 0.9283 |
| Previous Daily Low | 0.9167 |
| Previous Weekly High | 0.9410 |
| Previous Weekly Low | 0.9223 |
| Previous Monthly High | 0.9471 |
| Previous Monthly Low | 0.9201 |
| Daily Fibonacci 38.2% | 0.9211 |
| Daily Fibonacci 61.8% | 0.9239 |
| Daily Pivot Point S1 | 0.9158 |
| Daily Pivot Point S2 | 0.9105 |
| Daily Pivot Point S3 | 0.9042 |
| Daily Pivot Point R1 | 0.9274 |
| Daily Pivot Point R2 | 0.9337 |
| Daily Pivot Point R3 | 0.9390 |
[/s2If]
Join Our Telegram Group
")


