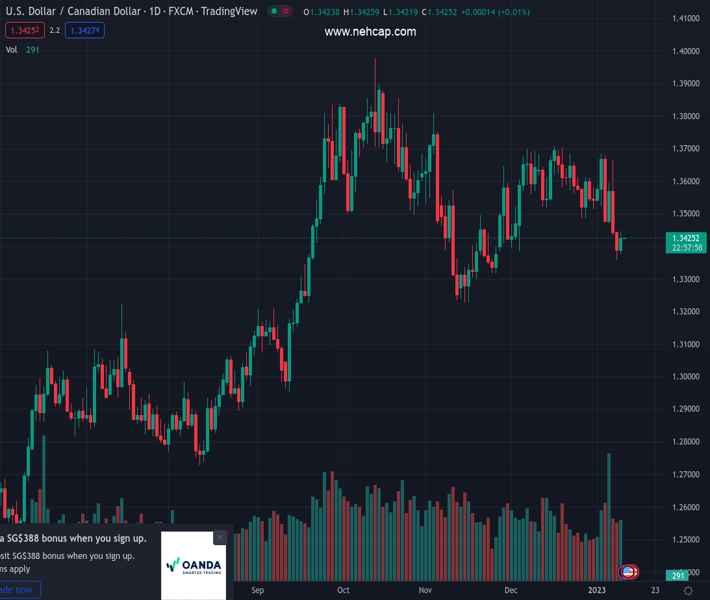
#USDCAD @ 1.34249 retreats from 100-day EMA after marking a corrective pullback from multi-day low., @nehcap view: Further downside expected (Pivot Orderbook analysis)
…
This is a premium post.
[s2If !current_user_can(access_s2member_level4)]Please register for PREMIUM VERSION HERE to read full post below containing analysis. In case of any error or you think you are not able to read the full post below, please email us at support#nehcap.com [lwa][/s2If] [s2If current_user_can(access_s2member_level4)]
- USD/CAD retreats from 100-day EMA after marking a corrective pullback from multi-day low.
- Clear downside break of a four-month-old ascending trend line, bearish MACD signals also favor sellers to aim for 1.3250.
- Buyers need validation from 1.3500 to retake control.
The pair currently trades last at 1.34249.
The previous day high was 1.3446 while the previous day low was 1.3357. The daily 38.2% Fib levels comes at 1.3391, expected to provide support. Similarly, the daily 61.8% fib level is at 1.3412, expected to provide support.
USD/CAD fades bounce off multi-day low, marked the previous day, as the 100-day Exponential Moving Average (EMA) challenges buyers during early Wednesday. That said, the quote currently retreats to 1.3420, after bouncing off the lowest levels since November 25 the previous day.
Not only the inability to cross the 100-day EMA but the Loonie pair’s sustained trading towards the south after breaking an ascending trend line from early September 2022, as well as the bearish MACD signals, also underpin the downside bias for the USD/CAD pair.
As a result, the USD/CAD is likely to decline towards the 1.3250 support confluence, including an upward-sloping support line from June and the 50% Fibonacci retracement level of the pair’s June-October 2022 upside.
Following that, July 2022 peak surrounding 1.3220 could act as the last defense of the pair buyers.
Alternatively, an upside clearance of the 100-day EMA, around 1.3430 by the press time, won’t offer a warm welcome to the USD/CAD buyers as the previous support line, close to 1.3470, acts as an extra filter towards the north.
Even if the quote rises past 1.3470, multiple lows marked since October 2022 around 1.3500 could offer additional challenges for the USD/CAD bulls.
Trend: Further downside expected
Technical Levels: Supports and Resistances
USDCAD currently trading at 1.3422 at the time of writing. Pair opened at 1.3389 and is trading with a change of 0.25% % .
| Overview | Overview.1 | |
|---|---|---|
| 0 | Today last price | 1.3422 |
| 1 | Today Daily Change | 0.0033 |
| 2 | Today Daily Change % | 0.25% |
| 3 | Today daily open | 1.3389 |
The pair is trading below its 20 Daily moving average @ 1.3576, below its 50 Daily moving average @ 1.3517 , below its 100 Daily moving average @ 1.3479 and above its 200 Daily moving average @ 1.3152
| Trends | Trends.1 | |
|---|---|---|
| 0 | Daily SMA20 | 1.3576 |
| 1 | Daily SMA50 | 1.3517 |
| 2 | Daily SMA100 | 1.3479 |
| 3 | Daily SMA200 | 1.3152 |
The previous day high was 1.3446 while the previous day low was 1.3357. The daily 38.2% Fib levels comes at 1.3391, expected to provide support. Similarly, the daily 61.8% fib level is at 1.3412, expected to provide support.
Note the levels of interest below:
- Pivot support is noted at 1.3349, 1.3308, 1.326
- Pivot resistance is noted at 1.3438, 1.3486, 1.3527
| Levels | Levels.1 |
|---|---|
| Previous Daily High | 1.3446 |
| Previous Daily Low | 1.3357 |
| Previous Weekly High | 1.3685 |
| Previous Weekly Low | 1.3433 |
| Previous Monthly High | 1.3705 |
| Previous Monthly Low | 1.3385 |
| Daily Fibonacci 38.2% | 1.3391 |
| Daily Fibonacci 61.8% | 1.3412 |
| Daily Pivot Point S1 | 1.3349 |
| Daily Pivot Point S2 | 1.3308 |
| Daily Pivot Point S3 | 1.3260 |
| Daily Pivot Point R1 | 1.3438 |
| Daily Pivot Point R2 | 1.3486 |
| Daily Pivot Point R3 | 1.3527 |
[/s2If]
Join Our Telegram Group
")


