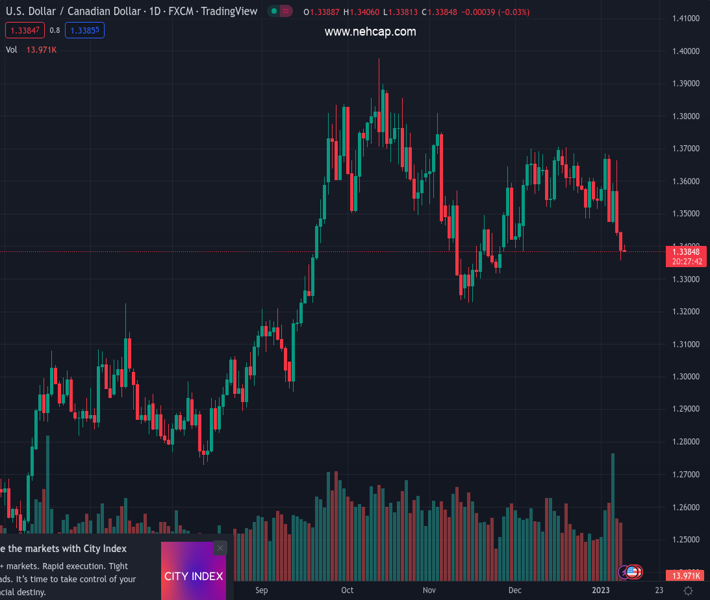
#USDCAD @ 1.33843 bulls are in play and testing 1.3400. (Pivot Orderbook analysis)
…
This is a premium post.
[s2If !current_user_can(access_s2member_level4)]Please register for PREMIUM VERSION HERE to read full post below containing analysis. In case of any error or you think you are not able to read the full post below, please email us at support#nehcap.com [lwa][/s2If] [s2If current_user_can(access_s2member_level4)]
- USD/CAD bulls are in play and testing 1.3400.
- US CPI could now be the key driver for the week.
The pair currently trades last at 1.33843.
The previous day high was 1.3446 while the previous day low was 1.3357. The daily 38.2% Fib levels comes at 1.3391, expected to provide resistance. Similarly, the daily 61.8% fib level is at 1.3412, expected to provide resistance.
USD/CAD is flat in Asia, testing 1.3400 having travelled between a tight range of 1.3381 and 1.3406 so far. The US Dollar is making a slight recovery although the domestic jobs data is keeping a lid on the pair as the prospects for higher local rates continue to support the Loonie.
While there is good news being priced into the markets as China reopens, supporting a bid in the oil price on the week so far, investors are looking ahead to this week’s United States inflation data following a slew of market-impacting economic data last week from the US economy to start the year off.
In the meanwhile, however, the stronger jobs number from Canada that came in data on Friday has put the Bank of Canada back in the hot seat. Analysts at TD Securities explained that ”another hike this month is not likely to resonate much with the CAD given where markets are priced. Instead, there is the chance that this hike – if realized – is perceived as its last given the pressures emerging on household imbalances and housing in general.”
As for USDCAD, the analysts at TD Securities ”think 1.35 acts as a broad anchor for now, but we expect a more definitive make-or-break moment for the pair and the CAD, in general, co the BoC decision;’
Technically, the analysts said, they note that ”USD/CAD is coiling into a flag formation established from the Oct highs/Aug 2022 lows.” Strategically, they are biased for CAD to underperform in the first half of this year. ”Tactically, the CAD is likely to remain steady to slightly firmer on crosses following the Nonfarm Payrolls number.”
Markets are still digesting Friday’s Nonfarm Payrolls giving credence to a pivot from the Federal Reserve. This is what makes this week’s inflation data so important. ”The jobs report was strong overall as Unemployment dropped back to the cycle low of 3.5%, supporting the view that the labour market remains red hot,” analysts at Brown Brothers Harriman explained.
”However, markets focused on the bigger than expected drop in average hourly earnings to 4.6% year over year.” However, the analysts argued that ”if the labour market remains as tight as it seems, wages are unlikely to fall much further in the coming months.”
Technical Levels: Supports and Resistances
USDCAD currently trading at 1.3396 at the time of writing. Pair opened at 1.3389 and is trading with a change of 0.05 % .
| Overview | Overview.1 | |
|---|---|---|
| 0 | Today last price | 1.3396 |
| 1 | Today Daily Change | 0.0007 |
| 2 | Today Daily Change % | 0.0500 |
| 3 | Today daily open | 1.3389 |
The pair is trading below its 20 Daily moving average @ 1.3576, below its 50 Daily moving average @ 1.3517 , below its 100 Daily moving average @ 1.3479 and above its 200 Daily moving average @ 1.3152
| Trends | Trends.1 | |
|---|---|---|
| 0 | Daily SMA20 | 1.3576 |
| 1 | Daily SMA50 | 1.3517 |
| 2 | Daily SMA100 | 1.3479 |
| 3 | Daily SMA200 | 1.3152 |
The previous day high was 1.3446 while the previous day low was 1.3357. The daily 38.2% Fib levels comes at 1.3391, expected to provide resistance. Similarly, the daily 61.8% fib level is at 1.3412, expected to provide resistance.
Note the levels of interest below:
- Pivot support is noted at 1.3349, 1.3308, 1.326
- Pivot resistance is noted at 1.3438, 1.3486, 1.3527
| Levels | Levels.1 |
|---|---|
| Previous Daily High | 1.3446 |
| Previous Daily Low | 1.3357 |
| Previous Weekly High | 1.3685 |
| Previous Weekly Low | 1.3433 |
| Previous Monthly High | 1.3705 |
| Previous Monthly Low | 1.3385 |
| Daily Fibonacci 38.2% | 1.3391 |
| Daily Fibonacci 61.8% | 1.3412 |
| Daily Pivot Point S1 | 1.3349 |
| Daily Pivot Point S2 | 1.3308 |
| Daily Pivot Point S3 | 1.3260 |
| Daily Pivot Point R1 | 1.3438 |
| Daily Pivot Point R2 | 1.3486 |
| Daily Pivot Point R3 | 1.3527 |
[/s2If]
Join Our Telegram Group
")


