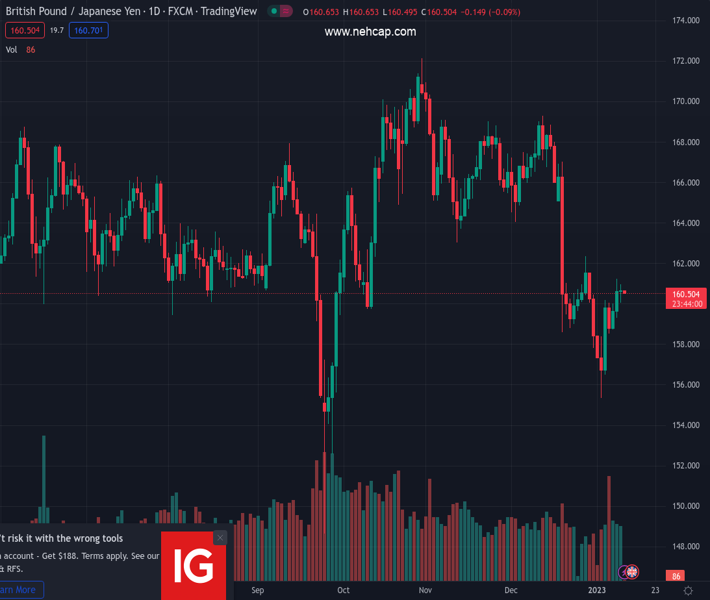
#GBPJPY @ 160.246 The three-day rally stalled around the 20-DMA and the 161.00 mark. (Pivot Orderbook analysis)
…
This is a premium post.
[s2If !current_user_can(access_s2member_level4)]Please register for PREMIUM VERSION HERE to read full post below containing analysis. In case of any error or you think you are not able to read the full post below, please email us at support#nehcap.com [lwa][/s2If] [s2If current_user_can(access_s2member_level4)]
- The GBP/JPY three-day rally stalled around the 20-DMA and the 161.00 mark.
- Oscillators suggest the GBP/JPY might continue its downtrend, but a decisive break above 161.00 could set the pair to challenge the 200-DMA.
The pair currently trades last at 160.246.
The previous day high was 161.24 while the previous day low was 159.32. The daily 38.2% Fib levels comes at 160.51, expected to provide resistance. Similarly, the daily 61.8% fib level is at 160.05, expected to provide support.
On Tuesday, the GBP/JPY registered solid gains, but the rally stalled around the 20-day Exponential Moving Average (EMA) at 161.08, as sellers leaning into it stepped in, dragging the GBP/JPY lower. Nevertheless, as Wednesday’s Asian session begins, the GBP/JPY is almost unchanged at around 161.02.
From a daily chart perspective, the GBP/JPY is neutral-to-downward biased. In the last two days, the GBP/JPY has been unable to crack the confluence of two technical indicators: the 20-day EMA and a five-month-old upslope support trendline, which turned resistance around the 161.00 mark. If the GBP/JPY pierces that latter, that would be the first step for higher prices, but its next hurdle would be the January 9 daily high of 161.24. A breach of the latter will clear the space towards the 200-day EMA at 162.50, followed by the 163.00 mark.
If that scenario is to play out, oscillators like the Relative Strength Index (RSI) would need to shift bullish, as it remains in bearish territory, while the Rate of Change (RoC) needs to show that selling pressure is waning. Otherwise, the GBP/JPY downtrend would resume.
Hence, the GBP/JPY first support would be the January 10 swing low of 160.04, followed by essential support levels like this week’s low of 159.30, ahead of 159.00.
Technical Levels: Supports and Resistances
GBPJPY currently trading at 160.72 at the time of writing. Pair opened at 160.54 and is trading with a change of 0.11 % .
| Overview | Overview.1 | |
|---|---|---|
| 0 | Today last price | 160.72 |
| 1 | Today Daily Change | 0.18 |
| 2 | Today Daily Change % | 0.11 |
| 3 | Today daily open | 160.54 |
The pair remains strongly bearish on the daily time frame. It trades below the 20 SMA @ 161.54, 50 SMA 164.71, 100 SMA @ 164.29 and 200 SMA @ 163.71.
| Trends | Trends.1 | |
|---|---|---|
| 0 | Daily SMA20 | 161.54 |
| 1 | Daily SMA50 | 164.71 |
| 2 | Daily SMA100 | 164.29 |
| 3 | Daily SMA200 | 163.71 |
The previous day high was 161.24 while the previous day low was 159.32. The daily 38.2% Fib levels comes at 160.51, expected to provide resistance. Similarly, the daily 61.8% fib level is at 160.05, expected to provide support.
Note the levels of interest below:
- Pivot support is noted at 159.49, 158.44, 157.56
- Pivot resistance is noted at 161.41, 162.29, 163.34
| Levels | Levels.1 |
|---|---|
| Previous Daily High | 161.24 |
| Previous Daily Low | 159.32 |
| Previous Weekly High | 160.18 |
| Previous Weekly Low | 155.36 |
| Previous Monthly High | 169.28 |
| Previous Monthly Low | 157.84 |
| Daily Fibonacci 38.2% | 160.51 |
| Daily Fibonacci 61.8% | 160.05 |
| Daily Pivot Point S1 | 159.49 |
| Daily Pivot Point S2 | 158.44 |
| Daily Pivot Point S3 | 157.56 |
| Daily Pivot Point R1 | 161.41 |
| Daily Pivot Point R2 | 162.29 |
| Daily Pivot Point R3 | 163.34 |
[/s2If]
Join Our Telegram Group
")


