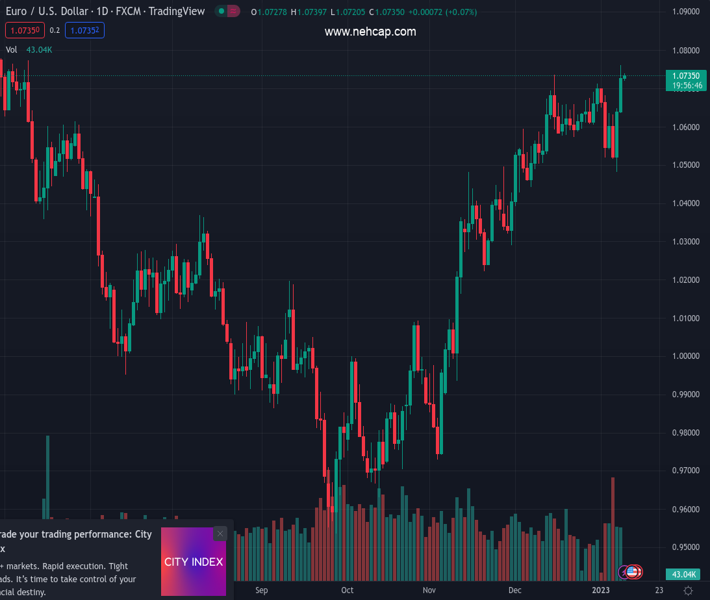
#EURUSD @ 1.07341 seesaws around seven-month high as the key resistance line challenges bulls., @nehcap view: Further upside expected (Pivot Orderbook analysis)
…
This is a premium post.
[s2If !current_user_can(access_s2member_level4)]Please register for PREMIUM VERSION HERE to read full post below containing analysis. In case of any error or you think you are not able to read the full post below, please email us at support#nehcap.com [lwa][/s2If] [s2If current_user_can(access_s2member_level4)]
- EUR/USD seesaws around seven-month high as the key resistance line challenges bulls.
- Successful trading beyond seven-week-old ascending trend line, impending bulls cross on MACD keep buyers hopeful.
- Sellers need validation from 50-day EMA to retake control.
The pair currently trades last at 1.07341.
The previous day high was 1.0761 while the previous day low was 1.0639. The daily 38.2% Fib levels comes at 1.0714, expected to provide support. Similarly, the daily 61.8% fib level is at 1.0686, expected to provide support.
EUR/USD bulls appear running out of steam as they jostle with an important resistance around 1.0730 during early Tuesday. In doing so, the major currency pair makes rounds to the seven-month high while probing a two-day uptrend.
That said, a downward-sloping resistance line from late May 2022, around 1.0730, joins the looming bull cross on the MACD indicators to keep the EUR/USD buyers hopeful.
However, the mid-2022 peak surrounding 1.0790 and the 1.0800 threshold act as extra filters towards the north before directing the EUR/USD prices to April 2022 peak near 1.0936.
In a case where the EUR/USD pair remains firmer past 1.0936, the 1.1000 psychological magnet will be in focus.
Alternatively, pullback moves may initially aim for a seven-week-long support line, close to 1.0540 to convince the EUR/USD bears.
Even so, the 50-day Exponential Moving Average (EMA) level surrounding 1.0460 could act as an extra downside buffer to probe the sellers.
It should be noted that the tops marked during August 2022 and lows of November 2022, close to 1.0370 and 1.0220 in that order, could act as the last defense of the EUR/USD buyers.
Trend: Further upside expected
Technical Levels: Supports and Resistances
EURUSD currently trading at 1.0736 at the time of writing. Pair opened at 1.0731 and is trading with a change of 0.05% % .
| Overview | Overview.1 | |
|---|---|---|
| 0 | Today last price | 1.0736 |
| 1 | Today Daily Change | 0.0005 |
| 2 | Today Daily Change % | 0.05% |
| 3 | Today daily open | 1.0731 |
The pair remains strongly bullish on the daily timeframe. It trades above its 20 SMA @ 1.0626, 50 SMA 1.0427, 100 SMA @ 1.0157 and 200 SMA @ 1.0312.
| Trends | Trends.1 | |
|---|---|---|
| 0 | Daily SMA20 | 1.0626 |
| 1 | Daily SMA50 | 1.0427 |
| 2 | Daily SMA100 | 1.0157 |
| 3 | Daily SMA200 | 1.0312 |
The previous day high was 1.0761 while the previous day low was 1.0639. The daily 38.2% Fib levels comes at 1.0714, expected to provide support. Similarly, the daily 61.8% fib level is at 1.0686, expected to provide support.
Note the levels of interest below:
- Pivot support is noted at 1.066, 1.0589, 1.0538
- Pivot resistance is noted at 1.0782, 1.0832, 1.0903
| Levels | Levels.1 |
|---|---|
| Previous Daily High | 1.0761 |
| Previous Daily Low | 1.0639 |
| Previous Weekly High | 1.0710 |
| Previous Weekly Low | 1.0483 |
| Previous Monthly High | 1.0736 |
| Previous Monthly Low | 1.0393 |
| Daily Fibonacci 38.2% | 1.0714 |
| Daily Fibonacci 61.8% | 1.0686 |
| Daily Pivot Point S1 | 1.0660 |
| Daily Pivot Point S2 | 1.0589 |
| Daily Pivot Point S3 | 1.0538 |
| Daily Pivot Point R1 | 1.0782 |
| Daily Pivot Point R2 | 1.0832 |
| Daily Pivot Point R3 | 1.0903 |
[/s2If]
Join Our Telegram Group
")


