#AUDUSD @ 0.69149 remains sidelined around four-month high, snaps two-day uptrend., @nehcap view: Bullish (Pivot Orderbook analysis)
…
This is a premium post.
[s2If !current_user_can(access_s2member_level4)]Please register for PREMIUM VERSION HERE to read full post below containing analysis. In case of any error or you think you are not able to read the full post below, please email us at support#nehcap.com [lwa][/s2If] [s2If current_user_can(access_s2member_level4)]
- AUD/USD remains sidelined around four-month high, snaps two-day uptrend.
- Eight-week-long ascending trend channel, sustained breakout of 200-DMA favor bulls.
- Multiple Fibonacci retracement levels add to the downside filters.
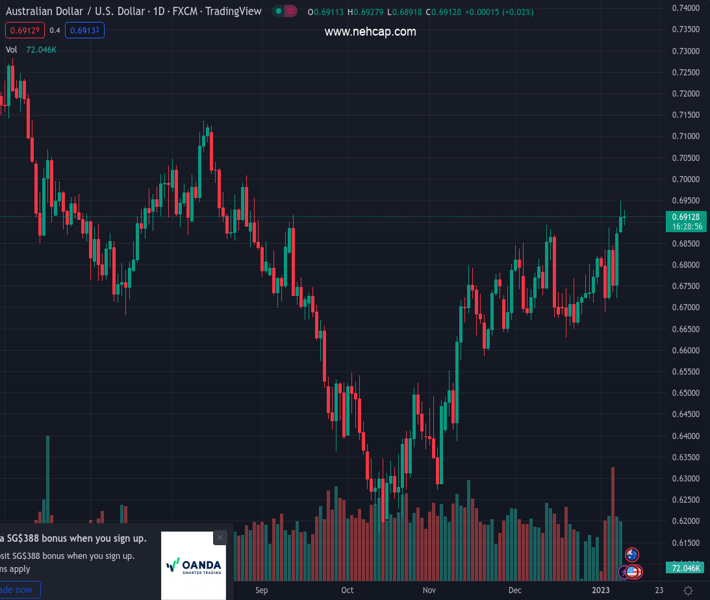
The pair currently trades last at 0.69149.
The previous day high was 0.695 while the previous day low was 0.6875. The daily 38.2% Fib levels comes at 0.6921, expected to provide resistance. Similarly, the daily 61.8% fib level is at 0.6904, expected to provide support.
AUD/USD struggles to defend the 0.6900 round figure as bulls retreat after poking the highest levels since late May the previous day.
Even so, the Aussie pair keeps Friday’s upside break of the 200-DMA inside a two-month-old bullish chart formation, namely ascending trend channel. Also keeping the AUD/USD buyers hopeful are the bullish MACD signals.
That said, the quote’s latest pullback could aim for the 61.8% Fibonacci retracement level of its June-October 2022 downside, near 0.6860, before challenging the 200-DMA support of 0.6838.
Should the AUD/USD prices drop back below the key moving average, a convergence of the 50% Fibonacci retracement level and lower line of the stated bullish channel could challenge the bears around 0.6730-25 before giving them control.
Following that, a slump toward the 38.2% Fibonacci retracement near 0.6600 can’t be ruled out.
Alternatively, the recent high near 0.6950 and the stated channel’s upper line, close to 0.6990 could challenge short-term AUD/USD buyers. It’s worth noting that the 0.7000 psychological magnet and late August 2022 swing high near 0.7010 act as additional resistances to test the pair’s upside momentum.
In a case where the AUD/USD price remains firmer past the 0.7010 threshold, the August 2022 peak of 0.7136 should return to the charts.
Trend: Bullish
Technical Levels: Supports and Resistances
AUDUSD currently trading at 0.6912 at the time of writing. Pair opened at 0.6912 and is trading with a change of 0.00% % .
| Overview | Overview.1 | |
|---|---|---|
| 0 | Today last price | 0.6912 |
| 1 | Today Daily Change | 0.0000 |
| 2 | Today Daily Change % | 0.00% |
| 3 | Today daily open | 0.6912 |
The pair remains strongly bullish on the daily timeframe. It trades above its 20 SMA @ 0.6763, 50 SMA 0.6694, 100 SMA @ 0.6635 and 200 SMA @ 0.6843.
| Trends | Trends.1 | |
|---|---|---|
| 0 | Daily SMA20 | 0.6763 |
| 1 | Daily SMA50 | 0.6694 |
| 2 | Daily SMA100 | 0.6635 |
| 3 | Daily SMA200 | 0.6843 |
The previous day high was 0.695 while the previous day low was 0.6875. The daily 38.2% Fib levels comes at 0.6921, expected to provide resistance. Similarly, the daily 61.8% fib level is at 0.6904, expected to provide support.
Note the levels of interest below:
- Pivot support is noted at 0.6875, 0.6838, 0.68
- Pivot resistance is noted at 0.695, 0.6987, 0.7025
| Levels | Levels.1 |
|---|---|
| Previous Daily High | 0.6950 |
| Previous Daily Low | 0.6875 |
| Previous Weekly High | 0.6887 |
| Previous Weekly Low | 0.6688 |
| Previous Monthly High | 0.6893 |
| Previous Monthly Low | 0.6629 |
| Daily Fibonacci 38.2% | 0.6921 |
| Daily Fibonacci 61.8% | 0.6904 |
| Daily Pivot Point S1 | 0.6875 |
| Daily Pivot Point S2 | 0.6838 |
| Daily Pivot Point S3 | 0.6800 |
| Daily Pivot Point R1 | 0.6950 |
| Daily Pivot Point R2 | 0.6987 |
| Daily Pivot Point R3 | 0.7025 |
[/s2If]
Join Our Telegram Group
")


