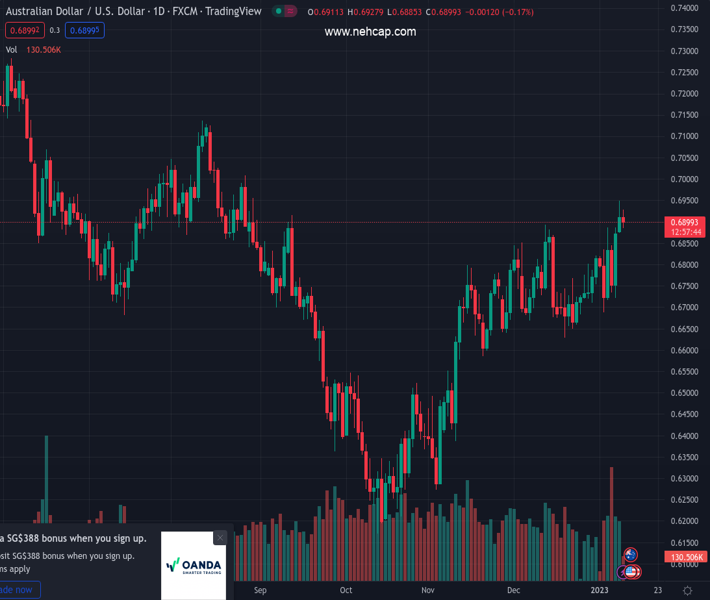
#AUDUSD @ 0.69040 is seen oscillating in a narrow trading band around the 0.6900 round figure. (Pivot Orderbook analysis)
…
This is a premium post.
[s2If !current_user_can(access_s2member_level4)]Please register for PREMIUM VERSION HERE to read full post below containing analysis. In case of any error or you think you are not able to read the full post below, please email us at support#nehcap.com [lwa][/s2If] [s2If current_user_can(access_s2member_level4)]
- AUD/USD is seen oscillating in a narrow trading band around the 0.6900 round figure.
- An uptick in the US bond yields helps revive the USD demand and acts as a headwind.
- Bets for less aggressive Fed rate hikes cap the buck and lend some support to the pair.
The pair currently trades last at 0.69040.
The previous day high was 0.695 while the previous day low was 0.6875. The daily 38.2% Fib levels comes at 0.6921, expected to provide resistance. Similarly, the daily 61.8% fib level is at 0.6904, expected to provide resistance.
The AUD/USD pair lacks any directional bias on Tuesday and consolidates its recent gains to the highest level since late August, around mid-0.6900s touched the previous day. Spot prices seesaw between tepid gains/minor losses through the first half of the European session and now seem to have stabilized near the 0.6900 mark.
A combination of factors assists the US Dollar to stall its recent downfall and regain some positive traction, which, in turn, is seen acting as a headwind for the AUD/USD pair. A modest uptick in the US Treasury bond yields helps revive the USD demand. Apart from this, the prevalent cautious market mood further underpins the safe-haven greenback and caps the upside for the risk-sensitive Aussie.
Despite China’s pivot away from its strict zero-COVID policy, investors remain worried that the massive flow of Chinese travellers may cause another surge in infections. Furthermore, the protracted Russia-Ukraine war has been fueling concerns about a deeper global economic downturn. This, in turn, takes its toll on the risk sentiment, which is evident from a softer tone around the equity markets.
That said, rising bets for relatively smaller rate hikes by the Federal Reserve could limit any further upside for the US bond yields and the greenback. The USD bulls also seem reluctant to place aggressive bets ahead of Fed Chair Jerome Powell’s speech, which will be looked upon for clues about the pace of rate hikes at the upcoming meetings. This will play a key role in driving the USD demand.
The focus, however, remains on the latest US consumer inflation figures, due for release on Thursday, which will help determine the next leg of a directional move for the AUD/USD pair. Nevertheless, the fundamental backdrop suggests that the path of least resistance for the USD is to the downside. This, in turn, supports prospects for an extension of the recent appreciating move for the major.
Technical Levels: Supports and Resistances
AUDUSD currently trading at 0.6905 at the time of writing. Pair opened at 0.6912 and is trading with a change of -0.1 % .
| Overview | Overview.1 | |
|---|---|---|
| 0 | Today last price | 0.6905 |
| 1 | Today Daily Change | -0.0007 |
| 2 | Today Daily Change % | -0.1000 |
| 3 | Today daily open | 0.6912 |
The pair remains strongly bullish on the daily timeframe. It trades above its 20 SMA @ 0.6763, 50 SMA 0.6694, 100 SMA @ 0.6635 and 200 SMA @ 0.6843.
| Trends | Trends.1 | |
|---|---|---|
| 0 | Daily SMA20 | 0.6763 |
| 1 | Daily SMA50 | 0.6694 |
| 2 | Daily SMA100 | 0.6635 |
| 3 | Daily SMA200 | 0.6843 |
The previous day high was 0.695 while the previous day low was 0.6875. The daily 38.2% Fib levels comes at 0.6921, expected to provide resistance. Similarly, the daily 61.8% fib level is at 0.6904, expected to provide resistance.
Note the levels of interest below:
- Pivot support is noted at 0.6875, 0.6838, 0.68
- Pivot resistance is noted at 0.695, 0.6987, 0.7025
| Levels | Levels.1 |
|---|---|
| Previous Daily High | 0.6950 |
| Previous Daily Low | 0.6875 |
| Previous Weekly High | 0.6887 |
| Previous Weekly Low | 0.6688 |
| Previous Monthly High | 0.6893 |
| Previous Monthly Low | 0.6629 |
| Daily Fibonacci 38.2% | 0.6921 |
| Daily Fibonacci 61.8% | 0.6904 |
| Daily Pivot Point S1 | 0.6875 |
| Daily Pivot Point S2 | 0.6838 |
| Daily Pivot Point S3 | 0.6800 |
| Daily Pivot Point R1 | 0.6950 |
| Daily Pivot Point R2 | 0.6987 |
| Daily Pivot Point R3 | 0.7025 |
[/s2If]
Join Our Telegram Group
")


