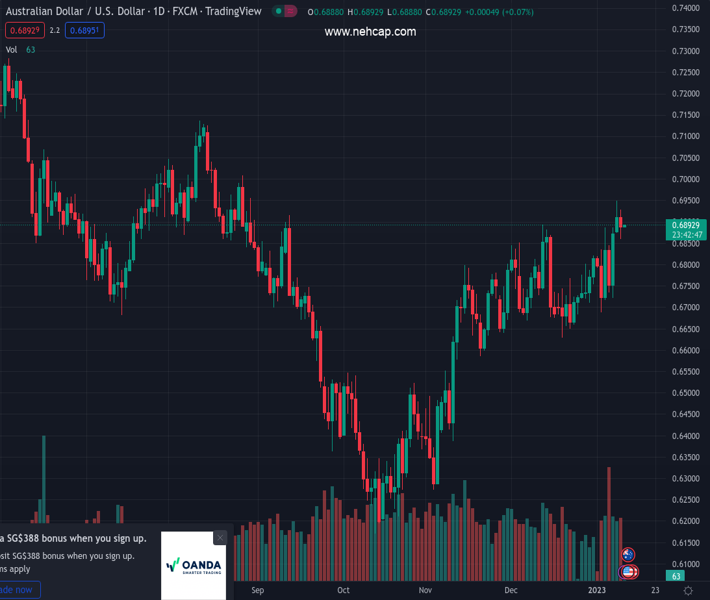
#AUDUSD @ 0.68924 is looking to claim 0.6900 ahead of the Australian CPI and Retail Sales data. (Pivot Orderbook analysis)
…
This is a premium post.
[s2If !current_user_can(access_s2member_level4)]Please register for PREMIUM VERSION HERE to read full post below containing analysis. In case of any error or you think you are not able to read the full post below, please email us at support#nehcap.com [lwa][/s2If] [s2If current_user_can(access_s2member_level4)]
- AUD/USD is looking to claim 0.6900 ahead of the Australian CPI and Retail Sales data.
- Market sentiment seems confusing as S&P500 remains solid while risk-perceived currencies witness correction.
- A decent increment in US Treasury yields has weighed down risk-sensitive currencies.
The pair currently trades last at 0.68924.
The previous day high was 0.695 while the previous day low was 0.6875. The daily 38.2% Fib levels comes at 0.6921, expected to provide resistance. Similarly, the daily 61.8% fib level is at 0.6904, expected to provide resistance.
The AUD/USD pair is struggling to recapture the immediate resistance of 0.6900 in the early Asian session after a gradual decline from 0.6950. The Aussie asset is expected to hog the limelight on Wednesday as the Australian Bureau of Statistics will report the monthly Consumer Price Index (CPI) data and monthly Retail Sales.
S&P500 continued its upside momentum on Tuesday, portraying that the risk profile is highly positive. The US Dollar Index (DXY) has continued to hover below 103.00, which indicates that investors are awaiting the release of the United States inflation data for fresh impetus. It seems that risk-perceived currencies have been impacted by a sheer gain in return derived from US Treasury bonds. The 10-year US Treasury yields climbed to near 3.61%.
As per the consensus, the monthly Australian CPI (Nov) is seen higher at 7.3% vs. the former release of 6.9%. Also, Retail Sales are seen higher at 0.6% against a contraction of 0.2% released earlier. Both catalysts are expected to compel the Reserve Bank of Australia (RBA) to continue hiking interest rates further to tame soaring inflation.
On the United States front, Thursday’s inflation data will remain in the spotlight. The headline CPI (Dec) is expected to continue its declining spree and may drop to 6.5% from the former figure of 7.1%. While the core CPI that excludes oil and food prices might slip to 5.7% from 6.0% reported earlier. A similar kind of outcome is going to delight the Federal Reserve (Fed) ahead.
Meanwhile, hawkish commentary from Fed Governor Michelle Bowman failed to infuse strength into the US Dollar. Reuters reported that Bowman said she expects the rate-setting Federal Open Market Committee “will continue raising interest rates to tighten monetary policy, as we stated after our December meeting,” while noting the pace of future actions will be driven by how the economy performs.
Technical Levels: Supports and Resistances
AUDUSD currently trading at 0.6885 at the time of writing. Pair opened at 0.6912 and is trading with a change of -0.39 % .
| Overview | Overview.1 | |
|---|---|---|
| 0 | Today last price | 0.6885 |
| 1 | Today Daily Change | -0.0027 |
| 2 | Today Daily Change % | -0.3900 |
| 3 | Today daily open | 0.6912 |
The pair remains strongly bullish on the daily timeframe. It trades above its 20 SMA @ 0.6763, 50 SMA 0.6694, 100 SMA @ 0.6635 and 200 SMA @ 0.6843.
| Trends | Trends.1 | |
|---|---|---|
| 0 | Daily SMA20 | 0.6763 |
| 1 | Daily SMA50 | 0.6694 |
| 2 | Daily SMA100 | 0.6635 |
| 3 | Daily SMA200 | 0.6843 |
The previous day high was 0.695 while the previous day low was 0.6875. The daily 38.2% Fib levels comes at 0.6921, expected to provide resistance. Similarly, the daily 61.8% fib level is at 0.6904, expected to provide resistance.
Note the levels of interest below:
- Pivot support is noted at 0.6875, 0.6838, 0.68
- Pivot resistance is noted at 0.695, 0.6987, 0.7025
| Levels | Levels.1 |
|---|---|
| Previous Daily High | 0.6950 |
| Previous Daily Low | 0.6875 |
| Previous Weekly High | 0.6887 |
| Previous Weekly Low | 0.6688 |
| Previous Monthly High | 0.6893 |
| Previous Monthly Low | 0.6629 |
| Daily Fibonacci 38.2% | 0.6921 |
| Daily Fibonacci 61.8% | 0.6904 |
| Daily Pivot Point S1 | 0.6875 |
| Daily Pivot Point S2 | 0.6838 |
| Daily Pivot Point S3 | 0.6800 |
| Daily Pivot Point R1 | 0.6950 |
| Daily Pivot Point R2 | 0.6987 |
| Daily Pivot Point R3 | 0.7025 |
[/s2If]
Join Our Telegram Group
")


