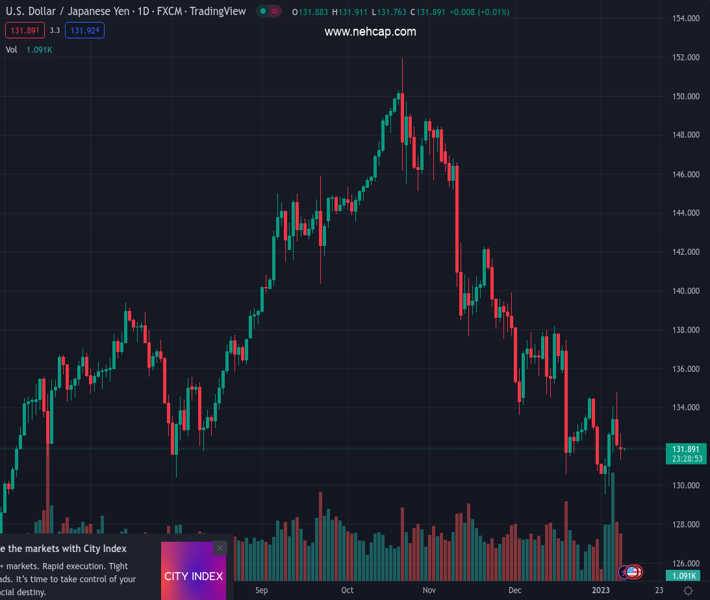
#USDJPY @ 131.901 falters to extend its downtrend after forming a bearish engulfing candle pattern. (Pivot Orderbook analysis)
…
This is a premium post.
[s2If !current_user_can(access_s2member_level4)]Please register for PREMIUM VERSION HERE to read full post below containing analysis. In case of any error or you think you are not able to read the full post below, please email us at support#nehcap.com [lwa][/s2If] [s2If current_user_can(access_s2member_level4)]
- USD/JPY falters to extend its downtrend after forming a bearish engulfing candle pattern.
- The RSI and the RoC suggest that the USD/JPY might resume downwards, though it needs the USD/JPY to fall below 131.30.
The pair currently trades last at 131.901.
The previous day high was 134.78 while the previous day low was 131.99. The daily 38.2% Fib levels comes at 133.06, expected to provide resistance. Similarly, the daily 61.8% fib level is at 133.71, expected to provide resistance.
The USD/JPY is almost flat as Monday’s New York session wanes, printing a doji preceded by a bearish engulfing candle pattern that failed to trigger downward action. The USD/JPY dived as low as 131.30, still almost unchanged, down by 0.17%. At the time of typing, the USD/JPY is trading at 131.88.
After testing the 200-day Exponential Moving Average (EMA) at around 134.70s on Friday, the USD/JPY remained almost unchanged as risk appetite improved and safe-haven peers weakened. Therefore, the USD/JPY seesawed between the high/low of 132.65-131.30 before stabilizing around 131.80s, without buyers/sellers having the upper hand. Should be said that the Relative Strength Index (RSI) portrays the pair as bearish biased, though the Rate of Change (RoC) shows momentum heading downwards.
Hence, the USD/JPY might resume its downtrend, but it would need to hurdle some support levels on its way down. The USD/JPY first support would be the January 9 daily low of 131.30. Break below will expose the 131.00 figure, followed by the January 4 swing low of 129.92 and the YTD low of 129.50.
Technical Levels: Supports and Resistances
USDJPY currently trading at 131.88 at the time of writing. Pair opened at 132.1 and is trading with a change of -0.17 % .
| Overview | Overview.1 | |
|---|---|---|
| 0 | Today last price | 131.88 |
| 1 | Today Daily Change | -0.22 |
| 2 | Today Daily Change % | -0.17 |
| 3 | Today daily open | 132.10 |
The pair remains strongly bearish on the daily time frame. It trades below the 20 SMA @ 133.72, 50 SMA 138.02, 100 SMA @ 140.95 and 200 SMA @ 136.46.
| Trends | Trends.1 | |
|---|---|---|
| 0 | Daily SMA20 | 133.72 |
| 1 | Daily SMA50 | 138.02 |
| 2 | Daily SMA100 | 140.95 |
| 3 | Daily SMA200 | 136.46 |
The previous day high was 134.78 while the previous day low was 131.99. The daily 38.2% Fib levels comes at 133.06, expected to provide resistance. Similarly, the daily 61.8% fib level is at 133.71, expected to provide resistance.
Note the levels of interest below:
- Pivot support is noted at 131.14, 130.17, 128.35
- Pivot resistance is noted at 133.92, 135.74, 136.7
| Levels | Levels.1 |
|---|---|
| Previous Daily High | 134.78 |
| Previous Daily Low | 131.99 |
| Previous Weekly High | 134.78 |
| Previous Weekly Low | 129.51 |
| Previous Monthly High | 138.18 |
| Previous Monthly Low | 130.57 |
| Daily Fibonacci 38.2% | 133.06 |
| Daily Fibonacci 61.8% | 133.71 |
| Daily Pivot Point S1 | 131.14 |
| Daily Pivot Point S2 | 130.17 |
| Daily Pivot Point S3 | 128.35 |
| Daily Pivot Point R1 | 133.92 |
| Daily Pivot Point R2 | 135.74 |
| Daily Pivot Point R3 | 136.70 |
[/s2If]
Join Our Telegram Group
")


