#USDJPY @ 131.328 takes offers to refresh intraday low, extends Friday’s U-turn from three-week high., @nehcap view: Limited downside expected (Pivot Orderbook analysis)
…
This is a premium post.
[s2If !current_user_can(access_s2member_level4)]Please register for PREMIUM VERSION HERE to read full post below containing analysis. In case of any error or you think you are not able to read the full post below, please email us at support#nehcap.com [lwa][/s2If] [s2If current_user_can(access_s2member_level4)]
- USD/JPY takes offers to refresh intraday low, extends Friday’s U-turn from three-week high.
- Oversold RSI conditions highlight immediate support line as the key challenge for bears.
- Convergence of 100, 200 EMAs appears a tough nut to crack for the buyers.
- Bearish MACD signals, sustained trading below important moving averages signal further downside.
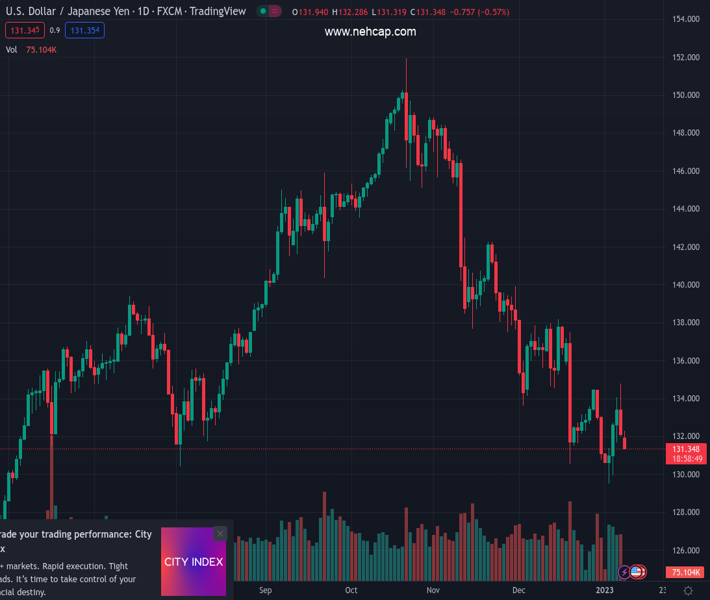
The pair currently trades last at 131.328.
The previous day high was 134.78 while the previous day low was 131.99. The daily 38.2% Fib levels comes at 133.06, expected to provide resistance. Similarly, the daily 61.8% fib level is at 133.71, expected to provide resistance.
USD/JPY stands on slippery grounds as the Yen pair renews its intraday low near 131.35 during early Monday. In doing so, the major currency pair extends the previous day’s pullback from the three-week high, as well as a downside break of the 100 and 200-hour Exponential Moving Average (EMA).
It’s worth noting that the oversold conditions of the RSI (14) suggest a limited downside of the USD/JPY prices, which in turn highlights the one-week-old ascending support line, close to the 131.00 threshold at the latest.
In a case where the USD/JPY bears dominate past 131.00, the recently flashed multi-month low, marked in the last week around 129.50, could act as the last defense of the buyers before directing the pair towards May 2022 low near 126.35.
On the contrary, USD/JPY recovery remains elusive unless the pair remains below the convergence of the aforementioned EMAs around 132.45-50.
Even so, the 134.05-10 region and the monthly high surrounding 134.80 could challenge the USD/JPY bulls before giving them control.
However, the USD/JPY buyers need to remain cautious until the quote trades below the previous monthly low of around 138.20.
Trend: Limited downside expected
Technical Levels: Supports and Resistances
USDJPY currently trading at 131.51 at the time of writing. Pair opened at 132.1 and is trading with a change of -0.45% % .
| Overview | Overview.1 | |
|---|---|---|
| 0 | Today last price | 131.51 |
| 1 | Today Daily Change | -0.59 |
| 2 | Today Daily Change % | -0.45% |
| 3 | Today daily open | 132.1 |
The pair remains strongly bearish on the daily time frame. It trades below the 20 SMA @ 133.72, 50 SMA 138.02, 100 SMA @ 140.95 and 200 SMA @ 136.46.
| Trends | Trends.1 | |
|---|---|---|
| 0 | Daily SMA20 | 133.72 |
| 1 | Daily SMA50 | 138.02 |
| 2 | Daily SMA100 | 140.95 |
| 3 | Daily SMA200 | 136.46 |
The previous day high was 134.78 while the previous day low was 131.99. The daily 38.2% Fib levels comes at 133.06, expected to provide resistance. Similarly, the daily 61.8% fib level is at 133.71, expected to provide resistance.
Note the levels of interest below:
- Pivot support is noted at 131.14, 130.17, 128.35
- Pivot resistance is noted at 133.92, 135.74, 136.7
| Levels | Levels.1 |
|---|---|
| Previous Daily High | 134.78 |
| Previous Daily Low | 131.99 |
| Previous Weekly High | 134.78 |
| Previous Weekly Low | 129.51 |
| Previous Monthly High | 138.18 |
| Previous Monthly Low | 130.57 |
| Daily Fibonacci 38.2% | 133.06 |
| Daily Fibonacci 61.8% | 133.71 |
| Daily Pivot Point S1 | 131.14 |
| Daily Pivot Point S2 | 130.17 |
| Daily Pivot Point S3 | 128.35 |
| Daily Pivot Point R1 | 133.92 |
| Daily Pivot Point R2 | 135.74 |
| Daily Pivot Point R3 | 136.70 |
[/s2If]
Join Our Telegram Group
")


