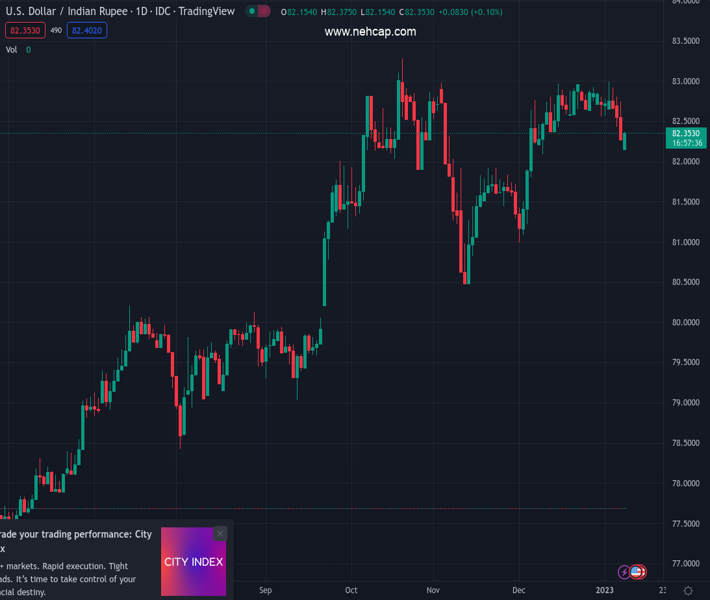
#USDINR @ 82.3700 dribbles near the lowest levels in one month. (Pivot Orderbook analysis)
…
This is a premium post.
[s2If !current_user_can(access_s2member_level4)]Please register for PREMIUM VERSION HERE to read full post below containing analysis. In case of any error or you think you are not able to read the full post below, please email us at support#nehcap.com [lwa][/s2If] [s2If current_user_can(access_s2member_level4)]
- USD/INR dribbles near the lowest levels in one month.
- China reopening joins PBOC headlines to underpin risk-on mood in Asia.
- Downbeat US wage growth weigh on Treasury yields and hawkish Fed bets.
- Japan holiday, light calendar and upbeat oil prices allow bears to lick their wounds.
The pair currently trades last at 82.3700.
The previous day high was 82.7856 while the previous day low was 82.1896. The daily 38.2% Fib levels comes at 82.4173, expected to provide resistance. Similarly, the daily 61.8% fib level is at 82.5579, expected to provide resistance.
USD/INR bears lick their wounds near 82.30, after refreshing a one-month low, as the Indian Rupee (INR) buyers await fresh clues during early Monday. In doing so, the quote remains indecisive after printing a three-day downtrend at the latest.
That said, China-inspired risk-on mood joins the broadly softer US Dollar to weigh on the USD/INR prices. However, a light calendar and the cautious mood ahead of this week’s key US inflation data, as well as the holiday in Japan, restrict the pair’s immediate moves.
It’s worth noting that China’s reopening of the international borders after a three-year blockage bolstered optimism in Asia. Also favoring the risk appetite could be early signals suggesting Beijing’s heavy shopping amid the year-end festive season. Furthermore, comments from the People’s Bank of China (PBOC) Official also hinted at robust growth expectations from the dragon nation and underpinned the firmer sentiment.
On the other hand, Friday’s downbeat prints of US Average Hourly Earnings, ISM Services PMI and Factory Orders pushed back the hawkish hopes from the Fed as the figures raised the US recession concerns, which in turn weighed on the US Dollar Index (DXY). Additionally, weighing on the DXY could be the mixed comments from the Fed policymakers and hopes of an upbeat US earnings season also seem to favor the USD/INR bears.
Alternatively, a light calendar and upbeat prices of Crude Oil put a floor under the USD/INR prices. The reason could be linked to India’s reliance on energy imports.
Amid these plays, S&OP 500 Futures print mild gains while India’s benchmark equity index BSE Sensex rises over 1.0% by the press time.
Moving on, a lack of major data/events and firmer oil prices can restrict the USD/INR pair’s immediate moves ahead of Thursday’s US Consumer Price Index (CPI) data.
A clear downside break of the 82.40 horizontal support favors USD/INR bears targeting the early December 2022 swing low near 82.10.
Technical Levels: Supports and Resistances
USDINR currently trading at 82.2916 at the time of writing. Pair opened at 82.1991 and is trading with a change of 0.11% % .
| Overview | Overview.1 | |
|---|---|---|
| 0 | Today last price | 82.2916 |
| 1 | Today Daily Change | 0.0925 |
| 2 | Today Daily Change % | 0.11% |
| 3 | Today daily open | 82.1991 |
The pair is trading below its 20 Daily moving average @ 82.6953, above its 50 Daily moving average @ 82.1216 , above its 100 Daily moving average @ 81.5664 and above its 200 Daily moving average @ 79.8023
| Trends | Trends.1 | |
|---|---|---|
| 0 | Daily SMA20 | 82.6953 |
| 1 | Daily SMA50 | 82.1216 |
| 2 | Daily SMA100 | 81.5664 |
| 3 | Daily SMA200 | 79.8023 |
The previous day high was 82.7856 while the previous day low was 82.1896. The daily 38.2% Fib levels comes at 82.4173, expected to provide resistance. Similarly, the daily 61.8% fib level is at 82.5579, expected to provide resistance.
Note the levels of interest below:
- Pivot support is noted at 81.9973, 81.7955, 81.4013
- Pivot resistance is noted at 82.5932, 82.9874, 83.1892
| Levels | Levels.1 |
|---|---|
| Previous Daily High | 82.7856 |
| Previous Daily Low | 82.1896 |
| Previous Weekly High | 83.0720 |
| Previous Weekly Low | 82.1896 |
| Previous Monthly High | 84.2500 |
| Previous Monthly Low | 80.9855 |
| Daily Fibonacci 38.2% | 82.4173 |
| Daily Fibonacci 61.8% | 82.5579 |
| Daily Pivot Point S1 | 81.9973 |
| Daily Pivot Point S2 | 81.7955 |
| Daily Pivot Point S3 | 81.4013 |
| Daily Pivot Point R1 | 82.5932 |
| Daily Pivot Point R2 | 82.9874 |
| Daily Pivot Point R3 | 83.1892 |
[/s2If]
Join Our Telegram Group
")


