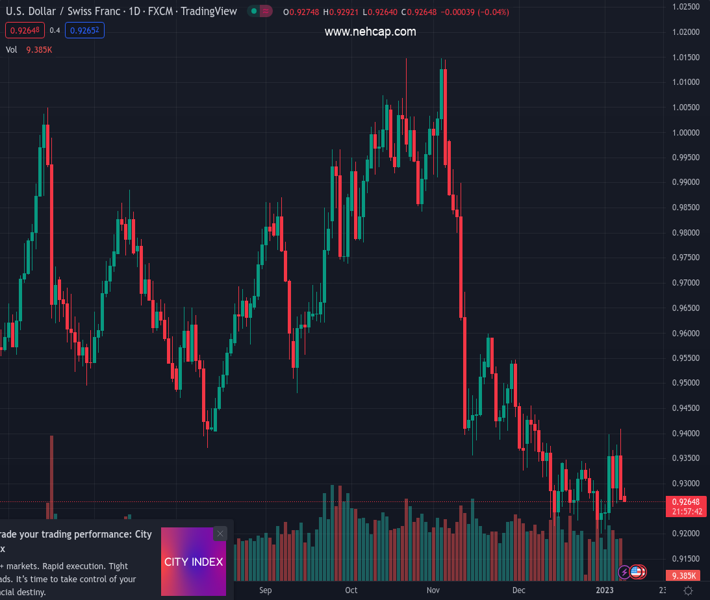
#USDCHF @ 0.92653 The Swiss Franc asset has sensed significant barricades around 0.9280 amid a risk-appetite theme. (Pivot Orderbook analysis)
…
This is a premium post.
[s2If !current_user_can(access_s2member_level4)]Please register for PREMIUM VERSION HERE to read full post below containing analysis. In case of any error or you think you are not able to read the full post below, please email us at support#nehcap.com [lwa][/s2If] [s2If current_user_can(access_s2member_level4)]
- The Swiss Franc asset has sensed significant barricades around 0.9280 amid a risk-appetite theme.
- A Double Top formation indicates a failed attempt of exploring fresh upside.
- The RSI (14) is failing to shift into the bullish range of 60.00-80.00.
The pair currently trades last at 0.92653.
The previous day high was 0.941 while the previous day low was 0.927. The daily 38.2% Fib levels comes at 0.9324, expected to provide resistance. Similarly, the daily 61.8% fib level is at 0.9356, expected to provide resistance.
The USD/CHF pair is likely to continue its downside journey below the immediate support of 0.9267 as investors have underpinned the risk-appetite theme in the market. The Swiss Franc asset has sensed significant barricades around 0.9280, which might infuse more pressure on the US Dollar ahead.
The US Dollar Index (DXY) is looking to re-test its six-month low around 103.05 amid risk-on profile as the Federal Reserve (Fed) is expected to slow down its pace of hiking interest rates after the release of the downbeat United States Average Hourly Earnings data.
The formation of a Double Top chart pattern on a four-hour scale around 0.9400 triggered immense selling pressure on USD/CHF. The aforementioned chart pattern indicates a failed attempt of exploring a fresh upside due to weak buying interest. Also, the 200-period Exponential Moving Average (EMA) around 0.9377 is acting as a major barricade for the US Dollar.
It is worth noting that the Relative Strength Index (RSI) (14) has faced barricades in shifting into the 60.00-80.00 range, which indicates that the upside bias is not solid anymore.
For further downside, the Swiss Franc bulls need to push the asset below December 30 low around 0.9200, which will drag the asset towards March 1 low at 0.9150 followed by January 21 low at 0.9108.
On the flip side, a decisive break above January 6 high at 0.9410 will drive the major towards December 6 high at 0.9456. A breach above the latter will send the major to psychological resistance around 0.9500.
Technical Levels: Supports and Resistances
USDCHF currently trading at 0.927 at the time of writing. Pair opened at 0.9277 and is trading with a change of -0.08 % .
| Overview | Overview.1 | |
|---|---|---|
| 0 | Today last price | 0.9270 |
| 1 | Today Daily Change | -0.0007 |
| 2 | Today Daily Change % | -0.0800 |
| 3 | Today daily open | 0.9277 |
The pair remains strongly bearish on the daily time frame. It trades below the 20 SMA @ 0.9297, 50 SMA 0.9474, 100 SMA @ 0.9644 and 200 SMA @ 0.9645.
| Trends | Trends.1 | |
|---|---|---|
| 0 | Daily SMA20 | 0.9297 |
| 1 | Daily SMA50 | 0.9474 |
| 2 | Daily SMA100 | 0.9644 |
| 3 | Daily SMA200 | 0.9645 |
The previous day high was 0.941 while the previous day low was 0.927. The daily 38.2% Fib levels comes at 0.9324, expected to provide resistance. Similarly, the daily 61.8% fib level is at 0.9356, expected to provide resistance.
Note the levels of interest below:
- Pivot support is noted at 0.9228, 0.918, 0.9089
- Pivot resistance is noted at 0.9367, 0.9458, 0.9506
| Levels | Levels.1 |
|---|---|
| Previous Daily High | 0.9410 |
| Previous Daily Low | 0.9270 |
| Previous Weekly High | 0.9410 |
| Previous Weekly Low | 0.9223 |
| Previous Monthly High | 0.9471 |
| Previous Monthly Low | 0.9201 |
| Daily Fibonacci 38.2% | 0.9324 |
| Daily Fibonacci 61.8% | 0.9356 |
| Daily Pivot Point S1 | 0.9228 |
| Daily Pivot Point S2 | 0.9180 |
| Daily Pivot Point S3 | 0.9089 |
| Daily Pivot Point R1 | 0.9367 |
| Daily Pivot Point R2 | 0.9458 |
| Daily Pivot Point R3 | 0.9506 |
[/s2If]
Join Our Telegram Group
")


