#USDCHF @ 0.92026 Overall, US Dollar weakness and improvement in risk appetite weighed on the pair. (Pivot Orderbook analysis)
…
This is a premium post.
[s2If !current_user_can(access_s2member_level4)]Please register for PREMIUM VERSION HERE to read full post below containing analysis. In case of any error or you think you are not able to read the full post below, please email us at support#nehcap.com [lwa][/s2If] [s2If current_user_can(access_s2member_level4)]
- Overall, US Dollar weakness and improvement in risk appetite weighed on the USD/CHF pair.
- A USD/CHF daily close below 0.9200 could exacerbate a fall toward 2022 yearly lows.
- Otherwise, the USD/CHF could bounce at around YTD lows and climb above 0.9300.
The pair currently trades last at 0.92026.
The previous day high was 0.941 while the previous day low was 0.927. The daily 38.2% Fib levels comes at 0.9324, expected to provide resistance. Similarly, the daily 61.8% fib level is at 0.9356, expected to provide resistance.
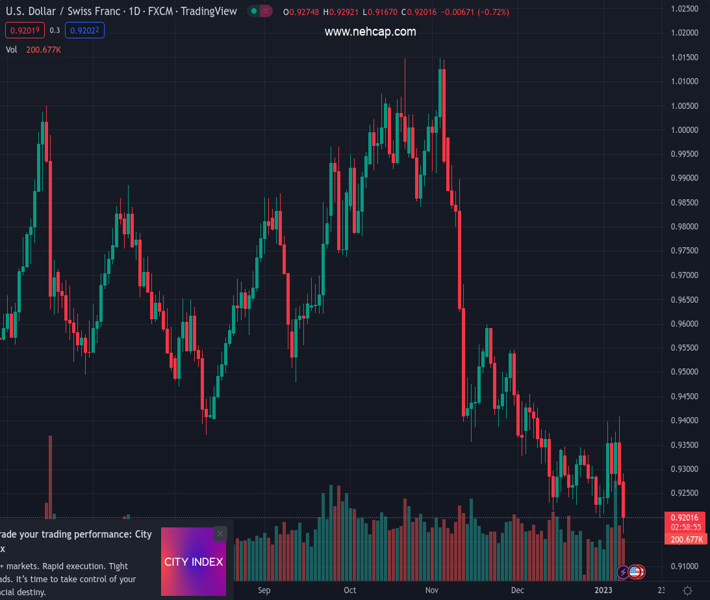
The USD/CHF drops back beneath a falling wedge top-trendline and extends its losses for two consecutive trading days, down by 0.73% as the US Dollar (USD) falls. At the time of writing, the USD/CHF is trading at 0.9202.
The USD/CHF daily chart portrays the resumption of the major’s downtrend. Failure to cling to gains around 0.9280s exacerbated a downfall toward its daily low of 0.9167, though buyers stepped around the daily lows, lifting the USD/CHF to current exchange rates. The USD/CHF stepped inside the falling wedge, a signal of bearishness. However, it would be needed a USD/CHF daily close below 0.9200 to pave the way for further downside. Otherwise, buyers could step in and lift the USD/CHF pair.
USD/CHF key support levels would be 0.9167. A breach of the latter would expose the February 21 daily low of 0.9150, followed by the 0.9100 mark, ahead of the 2022 year low of 0.9091. On the flip side, the USD/CHF first resistance would be 0.9200, which, once cleared, could pave the way towards today’s high of 0.9292, ahead of 0.9300.
Technical Levels: Supports and Resistances
USDCHF currently trading at 0.9199 at the time of writing. Pair opened at 0.9277 and is trading with a change of -0.84 % .
| Overview | Overview.1 | |
|---|---|---|
| 0 | Today last price | 0.9199 |
| 1 | Today Daily Change | -0.0078 |
| 2 | Today Daily Change % | -0.8400 |
| 3 | Today daily open | 0.9277 |
The pair remains strongly bearish on the daily time frame. It trades below the 20 SMA @ 0.9297, 50 SMA 0.9474, 100 SMA @ 0.9644 and 200 SMA @ 0.9645.
| Trends | Trends.1 | |
|---|---|---|
| 0 | Daily SMA20 | 0.9297 |
| 1 | Daily SMA50 | 0.9474 |
| 2 | Daily SMA100 | 0.9644 |
| 3 | Daily SMA200 | 0.9645 |
The previous day high was 0.941 while the previous day low was 0.927. The daily 38.2% Fib levels comes at 0.9324, expected to provide resistance. Similarly, the daily 61.8% fib level is at 0.9356, expected to provide resistance.
Note the levels of interest below:
- Pivot support is noted at 0.9228, 0.918, 0.9089
- Pivot resistance is noted at 0.9367, 0.9458, 0.9506
| Levels | Levels.1 |
|---|---|
| Previous Daily High | 0.9410 |
| Previous Daily Low | 0.9270 |
| Previous Weekly High | 0.9410 |
| Previous Weekly Low | 0.9223 |
| Previous Monthly High | 0.9471 |
| Previous Monthly Low | 0.9201 |
| Daily Fibonacci 38.2% | 0.9324 |
| Daily Fibonacci 61.8% | 0.9356 |
| Daily Pivot Point S1 | 0.9228 |
| Daily Pivot Point S2 | 0.9180 |
| Daily Pivot Point S3 | 0.9089 |
| Daily Pivot Point R1 | 0.9367 |
| Daily Pivot Point R2 | 0.9458 |
| Daily Pivot Point R3 | 0.9506 |
[/s2If]
Join Our Telegram Group
")


