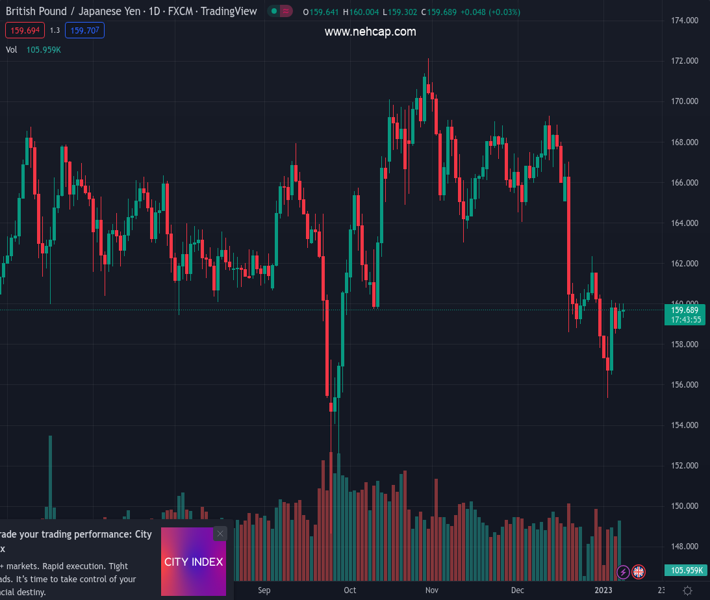
#GBPJPY @ 159.688 The formation of an ascending triangle chart pattern indicates a volatility contraction. (Pivot Orderbook analysis)
…
This is a premium post.
[s2If !current_user_can(access_s2member_level4)]Please register for PREMIUM VERSION HERE to read full post below containing analysis. In case of any error or you think you are not able to read the full post below, please email us at support#nehcap.com [lwa][/s2If] [s2If current_user_can(access_s2member_level4)]
- The formation of an ascending triangle chart pattern indicates a volatility contraction.
- Advancing 50-EMA indicates that the upside bias in the short term is still solid.
- A 40.00-60.00 range oscillation by the RSI (14) indicates that investors are awaiting a trigger for a decisive move.
The pair currently trades last at 159.688.
The previous day high was 160.02 while the previous day low was 158.74. The daily 38.2% Fib levels comes at 159.53, expected to provide support. Similarly, the daily 61.8% fib level is at 159.23, expected to provide support.
The GBP/JPY pair has corrected after facing barricades around the psychological resistance of 160.00 in the Asian session. The cross has slipped to near 159.50 and is likely to remain on tenterhooks amid volatility contraction. Trading activity is expected to remain quiet as Japanese markets are closed on account of Coming of Age Day.
On an hourly scale, the cross is auctioning in an Ascending Triangle chart pattern that signals a volatility contraction. Usually, a volatility contraction is followed by a breakout, which results in wider ticks and heavy volume. The horizontal resistance of the aforementioned chart pattern is plotted from January 4 high around 160.20 while the upward-sloping trendline is placed from January 5 low at 158.52.
At the time of writing, the cross is looking for support around the 20-period Exponential Moving Average (EMA) at 159.53 after a mild correction. While the 50-EMA at 159.25 is sloping north, which indicates that the short-term trend is solid.
The Relative Strength Index (RSI) (14) is oscillating in a 40.00-60.00 range, which indicates that investors are awaiting a fresh trigger for a decisive move.
For an upside move, the cross needs to deliver a breakout of the chart pattern above January 4 high around 160.20, which will drive the asset towards December 27 high around 161.00. An upside break of the latter will expose the cross for more upside to near December 28 high around 162.34.
Alternatively, a breakdown below January 5 low at 158.52 will drag the cross towards January 3 high at 157.46 followed by January 3 low at 155.36.
Technical Levels: Supports and Resistances
GBPJPY currently trading at 159.49 at the time of writing. Pair opened at 159.78 and is trading with a change of -0.18 % .
| Overview | Overview.1 | |
|---|---|---|
| 0 | Today last price | 159.49 |
| 1 | Today Daily Change | -0.29 |
| 2 | Today Daily Change % | -0.18 |
| 3 | Today daily open | 159.78 |
The pair remains strongly bearish on the daily time frame. It trades below the 20 SMA @ 161.96, 50 SMA 164.91, 100 SMA @ 164.3 and 200 SMA @ 163.71.
| Trends | Trends.1 | |
|---|---|---|
| 0 | Daily SMA20 | 161.96 |
| 1 | Daily SMA50 | 164.91 |
| 2 | Daily SMA100 | 164.30 |
| 3 | Daily SMA200 | 163.71 |
The previous day high was 160.02 while the previous day low was 158.74. The daily 38.2% Fib levels comes at 159.53, expected to provide support. Similarly, the daily 61.8% fib level is at 159.23, expected to provide support.
Note the levels of interest below:
- Pivot support is noted at 159.01, 158.23, 157.72
- Pivot resistance is noted at 160.29, 160.8, 161.58
| Levels | Levels.1 |
|---|---|
| Previous Daily High | 160.02 |
| Previous Daily Low | 158.74 |
| Previous Weekly High | 160.18 |
| Previous Weekly Low | 155.36 |
| Previous Monthly High | 169.28 |
| Previous Monthly Low | 157.84 |
| Daily Fibonacci 38.2% | 159.53 |
| Daily Fibonacci 61.8% | 159.23 |
| Daily Pivot Point S1 | 159.01 |
| Daily Pivot Point S2 | 158.23 |
| Daily Pivot Point S3 | 157.72 |
| Daily Pivot Point R1 | 160.29 |
| Daily Pivot Point R2 | 160.80 |
| Daily Pivot Point R3 | 161.58 |
[/s2If]
Join Our Telegram Group
")


