#EURUSD @ 1.06544 picks up bids to refresh intraday high, extends Friday’s U-turn from one-month low., @nehcap view: Further upside expected (Pivot Orderbook analysis)
…
This is a premium post.
[s2If !current_user_can(access_s2member_level4)]Please register for PREMIUM VERSION HERE to read full post below containing analysis. In case of any error or you think you are not able to read the full post below, please email us at support#nehcap.com [lwa][/s2If] [s2If current_user_can(access_s2member_level4)]
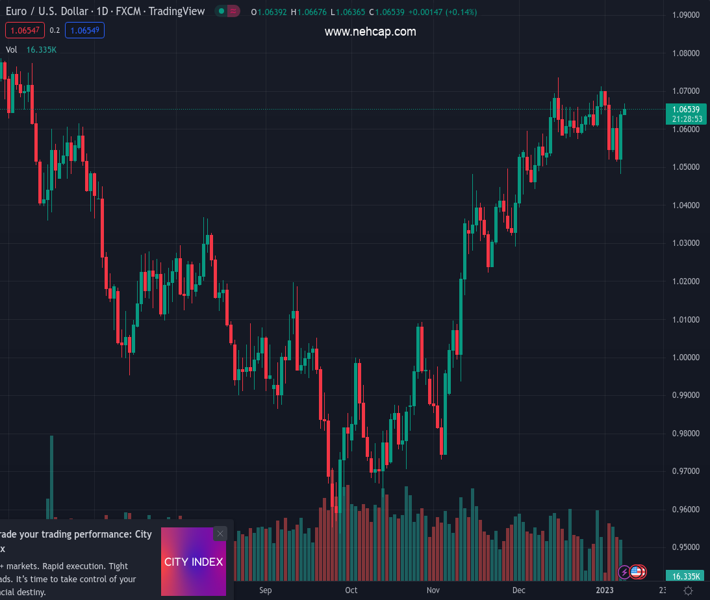
- EUR/USD picks up bids to refresh intraday high, extends Friday’s U-turn from one-month low.
- Upbeat oscillators, clear break of 100-SMA underpin bullish bias.
- Key Fibonacci retracement levels also restrict short-term EUR/USD downside.
- Three-week-old descending resistance line probes buyers ahead of December’s peak.
The pair currently trades last at 1.06544.
The previous day high was 1.0648 while the previous day low was 1.0483. The daily 38.2% Fib levels comes at 1.0585, expected to provide support. Similarly, the daily 61.8% fib level is at 1.0546, expected to provide support.
EUR/USD prints mild gains around 1.0665 as it extends the previous day’s rebound from a one-month low during Monday’s Asian session. In doing so, the major currency pair justifies the upside break of the 100-SMA, as well as the U-turn from the 50% Fibonacci retracement level of its November 21 to December 15 upside.
Also adding strength to the bullish bias could be the upbeat signals from the MACD and firmer RSI (14), not overbought.
As a result, the EUR/USD buyers are well-set to poke a downward-sloping resistance line from mid-December, around 1.0700 by the press time.
However, the previous monthly high surrounding 1.0735 could challenge the bulls afterward.
Following that, a run-up towards the May 2022 peak near 1.0790 and the 1.0800 threshold can’t be ruled out.
Alternatively, the EUR/USD pair’s pullback moves remain elusive unless the quote stays beyond the 100-SMA, currently around 1.0620.
Even so, the 50% and the 61.8% Fibonacci retracement levels, close to 1.0480 and 1.0420 in that order, could challenge the EUR/USD bears.
In a case where the pair remains weak past 1.0420, the odds of witnessing a slump to the November 30 low near 1.0290 can’t be ruled out.
Trend: Further upside expected
Technical Levels: Supports and Resistances
EURUSD currently trading at 1.0665 at the time of writing. Pair opened at 1.0646 and is trading with a change of 0.18% % .
| Overview | Overview.1 | |
|---|---|---|
| 0 | Today last price | 1.0665 |
| 1 | Today Daily Change | 0.0019 |
| 2 | Today Daily Change % | 0.18% |
| 3 | Today daily open | 1.0646 |
The pair remains strongly bullish on the daily timeframe. It trades above its 20 SMA @ 1.0616, 50 SMA 1.041, 100 SMA @ 1.015 and 200 SMA @ 1.0314.
| Trends | Trends.1 | |
|---|---|---|
| 0 | Daily SMA20 | 1.0616 |
| 1 | Daily SMA50 | 1.0410 |
| 2 | Daily SMA100 | 1.0150 |
| 3 | Daily SMA200 | 1.0314 |
The previous day high was 1.0648 while the previous day low was 1.0483. The daily 38.2% Fib levels comes at 1.0585, expected to provide support. Similarly, the daily 61.8% fib level is at 1.0546, expected to provide support.
Note the levels of interest below:
- Pivot support is noted at 1.0537, 1.0427, 1.0372
- Pivot resistance is noted at 1.0702, 1.0757, 1.0867
| Levels | Levels.1 |
|---|---|
| Previous Daily High | 1.0648 |
| Previous Daily Low | 1.0483 |
| Previous Weekly High | 1.0710 |
| Previous Weekly Low | 1.0483 |
| Previous Monthly High | 1.0736 |
| Previous Monthly Low | 1.0393 |
| Daily Fibonacci 38.2% | 1.0585 |
| Daily Fibonacci 61.8% | 1.0546 |
| Daily Pivot Point S1 | 1.0537 |
| Daily Pivot Point S2 | 1.0427 |
| Daily Pivot Point S3 | 1.0372 |
| Daily Pivot Point R1 | 1.0702 |
| Daily Pivot Point R2 | 1.0757 |
| Daily Pivot Point R3 | 1.0867 |
[/s2If]
Join Our Telegram Group
")


