#XAUUSD @ 1,852.01 US Nonfarm Payrolls exceeded estimates of 200K, while the unemployment rate edged lower. (Pivot Orderbook analysis)
…
This is a premium post.
[s2If !current_user_can(access_s2member_level4)]Please register for PREMIUM VERSION HERE to read full post below containing analysis. In case of any error or you think you are not able to read the full post below, please email us at support#nehcap.com [lwa][/s2If] [s2If current_user_can(access_s2member_level4)]
- US Nonfarm Payrolls exceeded estimates of 200K, while the unemployment rate edged lower.
- Average Hourly Earnings were lower than the 5% foreseen, signaling the absence of a wage spiral.
- Gold Price Forecast: To find solid resistance around $1,852-$1,860.
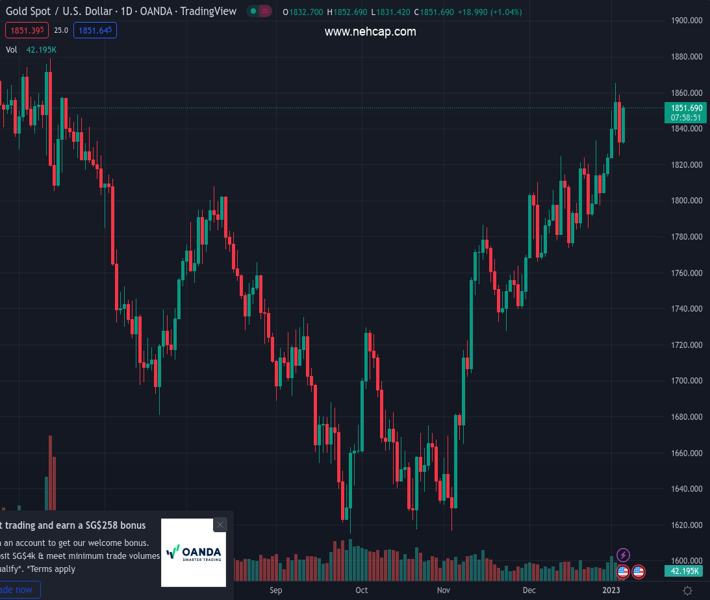
The pair currently trades last at 1852.01.
The previous day high was 1859.11 while the previous day low was 1825.08. The daily 38.2% Fib levels comes at 1838.08, expected to provide support. Similarly, the daily 61.8% fib level is at 1846.11, expected to provide support.
Gold price extends its gains after the US Nonfarm Payrolls showed the US economy added more jobs than estimates while the rate of unemployed Americans edged lower. At the time of writing, XAU/USD trades volatile around the $1,837-$1,844 range.
The US Bureau of Labor Statistics revealed that December’s Nonfarm Payrolls rose by 223K above the 200K estimates, signaling the robustness of the labor market and justifying the need for further Federal Reserve (Fed) action. In the meantime, the Unemployment Rate tumbled to 3.5%, while Average Hourly Earnings dropped to 4.6% YoY, vs. estimates of 5%.
Meanwhile, the US Dollar Index is almost flat around 105.223, while the US 10-year Treasury bond yield is unchanged at 3.72%, a reason for Gold to continue extending its gains.
XAU/USD 1-hour chart broke higher on the release, towards $1,843.75, and quickly stabilized just shy of the daily pivot point at around $1,838.85. On the upside, XAU/USD was capped by the 50-EMA around $1,840, though it remains trading volatile as investors assess the overall US jobs market.
On the upside, the next resistance would be the R1 daily pivot point at around $1,852.67, followed by the January 5 daily high of $1,859.03. As an alternate scenario, the XAU/USD first support would be the pivot point around $1,838.85, followed by the 200-ENA at $1,828.68, followed by January’s 5 daily low of $1,825.04 and the S1 pivot level at $1,818.68.
Technical Levels: Supports and Resistances
XAUUSD currently trading at 1847.86 at the time of writing. Pair opened at 1833.21 and is trading with a change of 0.8 % .
| Overview | Overview.1 | |
|---|---|---|
| 0 | Today last price | 1847.86 |
| 1 | Today Daily Change | 14.65 |
| 2 | Today Daily Change % | 0.80 |
| 3 | Today daily open | 1833.21 |
The pair remains strongly bullish on the daily timeframe. It trades above its 20 SMA @ 1808.7, 50 SMA 1764.24, 100 SMA @ 1725.76 and 200 SMA @ 1778.45.
| Trends | Trends.1 | |
|---|---|---|
| 0 | Daily SMA20 | 1808.70 |
| 1 | Daily SMA50 | 1764.24 |
| 2 | Daily SMA100 | 1725.76 |
| 3 | Daily SMA200 | 1778.45 |
The previous day high was 1859.11 while the previous day low was 1825.08. The daily 38.2% Fib levels comes at 1838.08, expected to provide support. Similarly, the daily 61.8% fib level is at 1846.11, expected to provide support.
Note the levels of interest below:
- Pivot support is noted at 1819.16, 1805.1, 1785.13
- Pivot resistance is noted at 1853.19, 1873.16, 1887.22
| Levels | Levels.1 |
|---|---|
| Previous Daily High | 1859.11 |
| Previous Daily Low | 1825.08 |
| Previous Weekly High | 1833.38 |
| Previous Weekly Low | 1797.11 |
| Previous Monthly High | 1833.38 |
| Previous Monthly Low | 1765.89 |
| Daily Fibonacci 38.2% | 1838.08 |
| Daily Fibonacci 61.8% | 1846.11 |
| Daily Pivot Point S1 | 1819.16 |
| Daily Pivot Point S2 | 1805.10 |
| Daily Pivot Point S3 | 1785.13 |
| Daily Pivot Point R1 | 1853.19 |
| Daily Pivot Point R2 | 1873.16 |
| Daily Pivot Point R3 | 1887.22 |
[/s2If]
Join Our Telegram Group
")


